
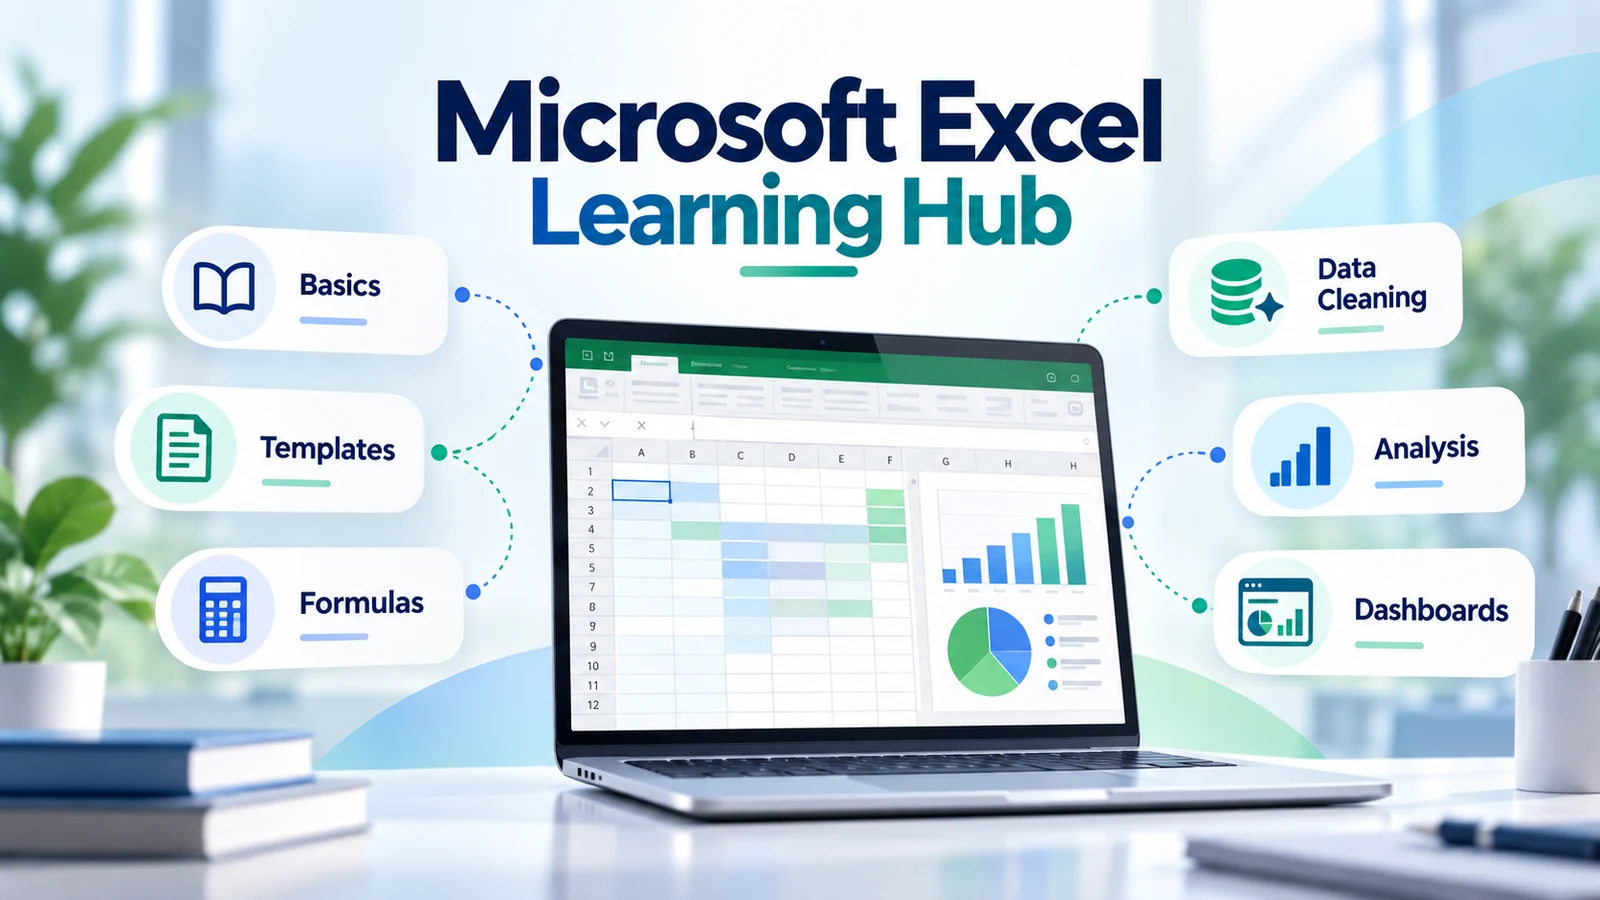
Microsoft Excel remains one of the most useful tools for organizing information, analyzing data, building reports, and managing everyday work. These Microsoft Excel guides bring together TechTeamSynergy’s practical tutorials, examples, and templates so you can move from basic spreadsheet skills to formulas, data cleaning, analysis, and dashboards with a clear learning path.
Whether you are opening Excel for the first time, improving a workbook you already use, cleaning data, building reusable templates, or preparing to work with PivotTables and Power Query, start with the section that matches your current level.
For official product references, you can also use Microsoft’s Excel Help & Learning, its overview of formulas in Excel, and the official XLOOKUP function reference.
Microsoft Excel Guides: Start Here and Learn Step by Step
If you are new to Excel, begin with the fundamentals. Learn how workbooks, worksheets, cells, ranges, formulas, tables, sorting, filtering, and charts fit together before moving into more advanced features.
Excel for Beginners: Learn the Basics Step by Step
A practical introduction to the Excel interface, data entry, basic formulas, functions, references, tables, sorting, filtering, and charts. This is the best starting point if you want a structured foundation before tackling intermediate Excel skills.
How to Use Excel: Practical Skills for Everyday Work
Move beyond the basics with practical spreadsheet techniques for real work. The guide introduces tables, IF, SUMIFS, XLOOKUP, conditional formatting, data validation, PivotTables, charts, dynamic arrays, and Power Query.
Build Better Workbooks
Good spreadsheets are not only accurate. They are also easier to use, maintain, and reuse. These Microsoft Excel guides focus on practical workbook design techniques that improve consistency and reduce repetitive work.
Create Controlled Inputs with Drop-Down Lists
Drop-down lists are one of the simplest ways to improve spreadsheet quality. They help users select from predefined values instead of typing inconsistent entries manually.
Learn how to create a drop-down list in Excel, including practical data-validation techniques and examples you can reuse in operational trackers, project files, and reporting workbooks.
Use Excel Templates More Effectively
Templates can save time and improve consistency across recurring tasks. Instead of rebuilding the same workbook every week or month, you can create a reusable structure for project tracking, budgets, reports, checklists, schedules, and operational activities.
Explore the Excel templates guide to learn how to use, customize, and create reusable spreadsheet templates.
Clean and Organize Your Data
Analysis is only as reliable as the data behind it. Duplicate records, inconsistent values, blank cells, and uncontrolled inputs can make reports misleading and harder to maintain.
Remove Duplicate Records
Duplicate values are common when information comes from several systems, manual exports, surveys, or collaborative workbooks. Excel provides several approaches for identifying and removing duplicate records depending on the situation.
See six practical ways to remove duplicates in Excel and choose the method that best fits your dataset.
Microsoft Excel Guides for Formulas and Functions
Formulas are where Excel becomes much more than a digital table. They allow a workbook to calculate results automatically, test conditions, summarize data, retrieve values, and build repeatable business logic.
Start with simple arithmetic and core functions such as SUM, AVERAGE, MIN, MAX, and COUNT. Then progress to conditional logic and analysis using functions such as IF, SUMIF, SUMIFS, COUNTIF, COUNTIFS, and XLOOKUP.
Continue with the dedicated Excel Formulas & Functions guide for a structured path from basic formulas to practical business examples using IF, SUMIFS, COUNTIFS, XLOOKUP, text functions, dates, and reporting formulas.
Microsoft Excel Guides for Data Analysis
Once your data is structured correctly, Excel can help turn rows and columns into useful insights. The next level of the learning path focuses on summarizing, comparing, visualizing, and transforming larger datasets.
PivotTables
PivotTables make it possible to summarize large datasets quickly without writing complex formulas. They are especially useful for project reporting, operational reviews, financial summaries, sales analysis, and category-based comparisons.
Conditional Formatting
Conditional formatting helps important information stand out automatically. It can highlight overdue actions, high-risk items, unusual values, performance thresholds, duplicates, and trends directly inside a workbook.
Power Query
Power Query is one of Excel’s most powerful tools for repeatable data preparation. It can import, clean, transform, combine, and refresh data without repeating the same manual steps every reporting cycle.
Dashboards
Excel dashboards combine structured data, calculations, PivotTables, charts, KPIs, filters, and clear visual design into a compact decision-support view. They are especially useful when different stakeholders need a shared picture of progress or performance.
Excel for Project Managers
Excel is still widely used in project environments because it is flexible, familiar, and easy to adapt. Project managers can use it for planning, responsibility assignment, action tracking, risk management, reporting, budgets, and stakeholder communication.
TechTeamSynergy already provides a free RACI Matrix Excel template for assigning Responsible, Accountable, Consulted, and Informed roles across project activities.
This hub will progressively expand with more practical Excel resources for project managers, including project trackers, RAID logs, risk registers, status dashboards, budget trackers, and action logs.
Recommended Excel Learning Path
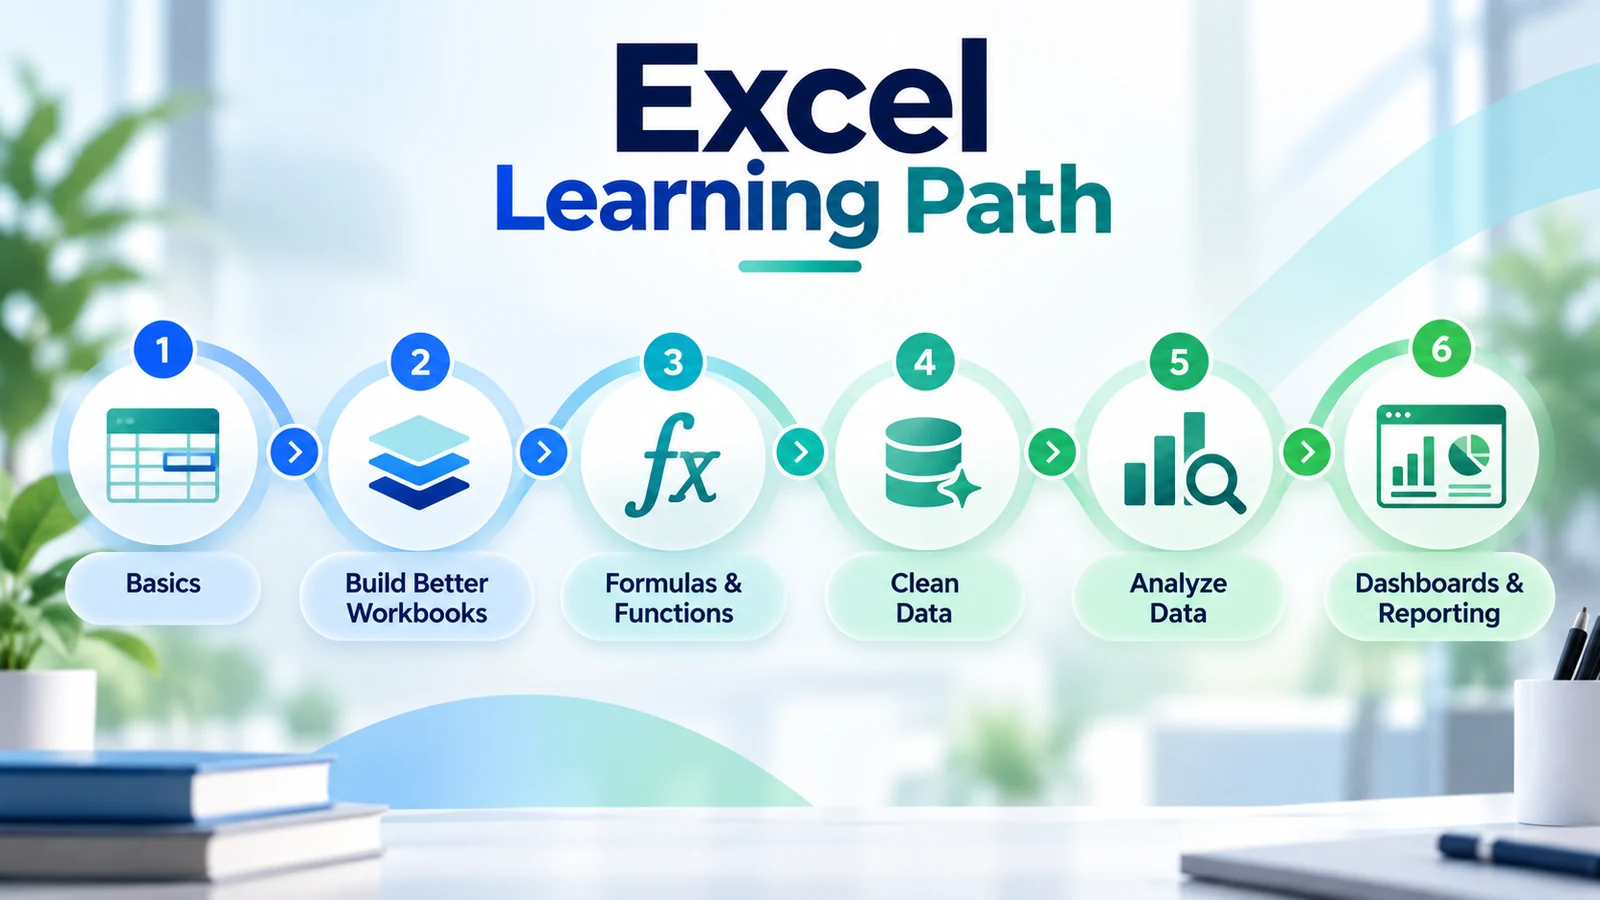
- Learn the basics: interface, cells, ranges, formulas, tables, sorting, filtering, and charts.
- Build reliable workbooks: templates, data validation, drop-down lists, and clean input structures.
- Master formulas: IF, SUMIFS, COUNTIFS, XLOOKUP, and other practical functions.
- Clean data: remove duplicates and improve consistency before analysis.
- Analyze: use PivotTables and conditional formatting to find patterns and exceptions.
- Automate preparation: use Power Query for repeatable data transformations.
- Communicate insights: create dashboards and management-ready reports.
Continue Learning
TechTeamSynergy focuses on practical technology, project management, team effectiveness, and digital transformation. These Microsoft Excel guides will continue to grow as new tutorials, examples, and downloadable resources are published.