
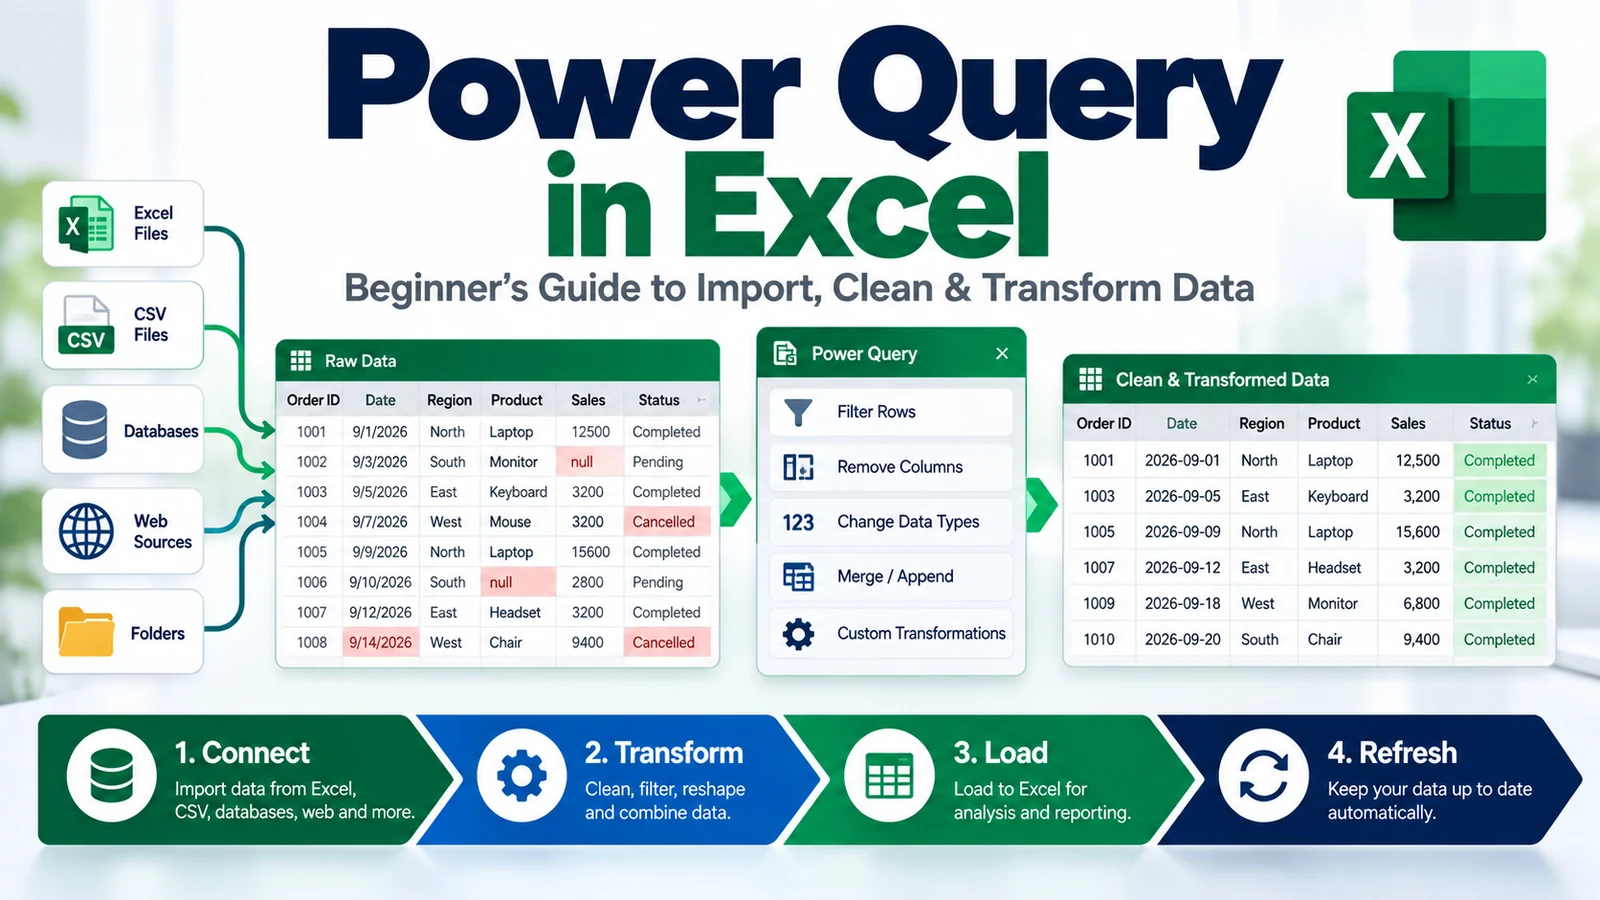
Power Query in Excel helps you connect to data, clean it, transform it, combine it, and refresh the result without repeating the same manual steps every time. Instead of copying columns, deleting rows, fixing formats, and merging files by hand each month, you can record those transformations once and reuse them.
This beginner-friendly guide explains how to use Power Query in Excel, how the Get & Transform workflow works, how to import data, clean and reshape it in the Power Query Editor, load it back into Excel, and refresh it when the source changes.
If you are following the TechTeamSynergy Excel learning path, start with the Microsoft Excel Learning Hub. For calculations, see Excel Formulas & Functions. For interactive summaries, continue with PivotTables in Excel, and for visual exception highlighting see Conditional Formatting in Excel.
Microsoft describes Power Query, also known as Get & Transform in Excel, as a way to connect to external data, shape it by removing columns, changing data types, merging tables and other transformations, then load the result into Excel and refresh it later. See Microsoft’s Power Query overview, data import guide, and query creation and loading guide.
What Is Power Query in Excel?
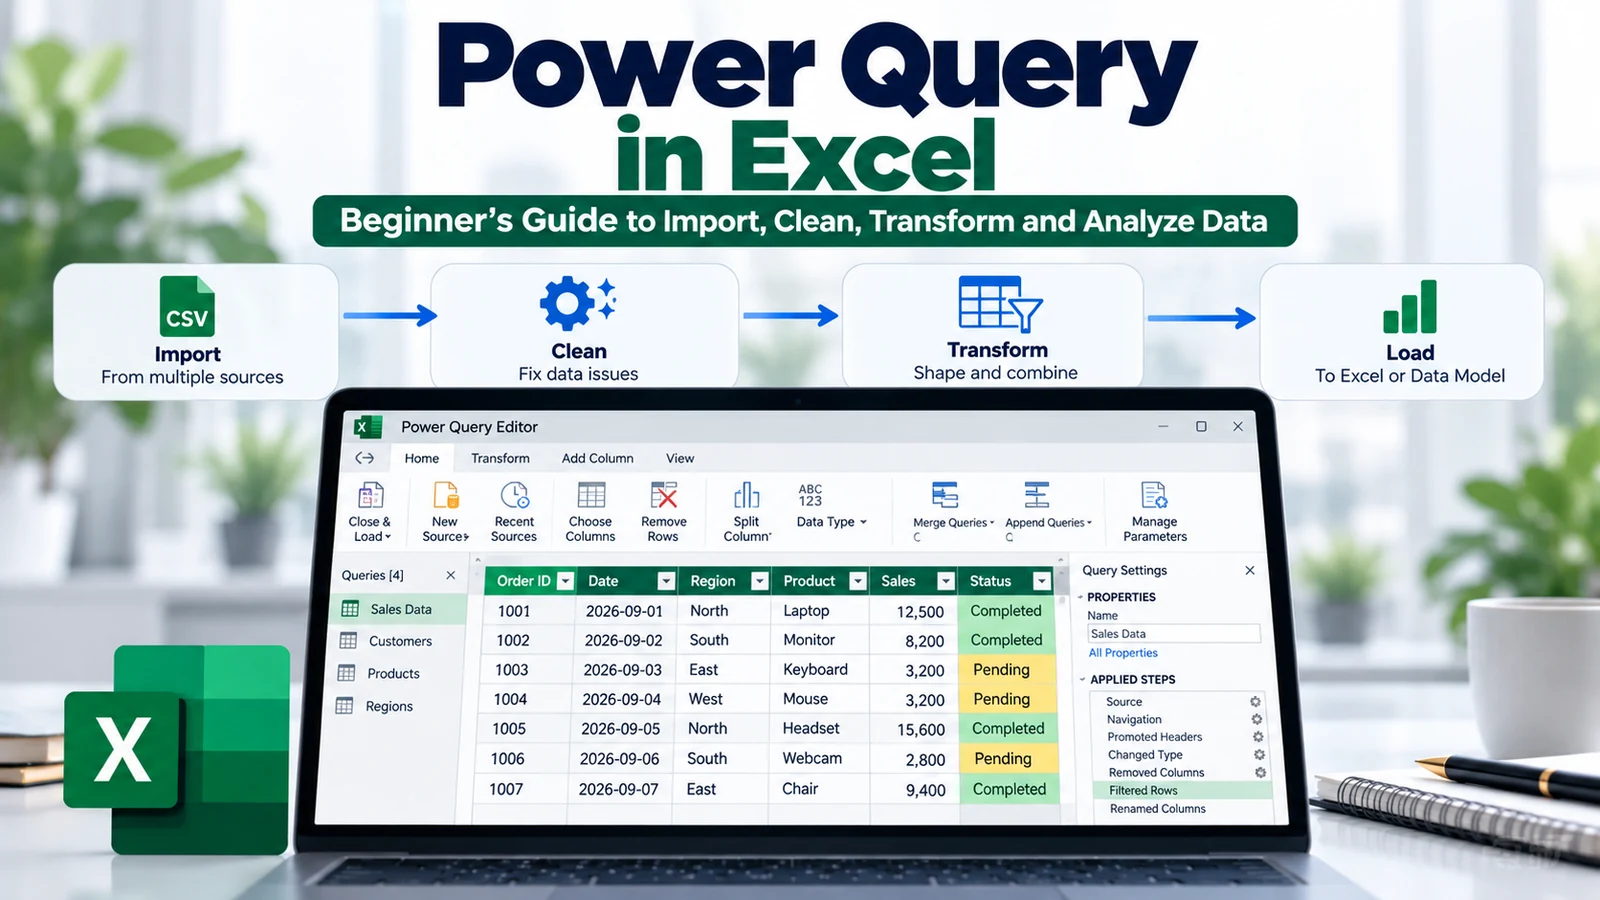
Power Query is a data-preparation technology built into modern Excel versions. It lets you create a repeatable sequence of steps that turns raw data into a cleaner, more useful table.
A typical Power Query workflow looks like this:
Connect → Transform → Load → Refresh
That means you can:
- Connect to a source.
- Transform the data in the Power Query Editor.
- Load the result into Excel.
- Refresh the query when the source data changes.
The major benefit is repeatability. Power Query remembers the transformation steps, so you do not need to rebuild the cleanup process from scratch every reporting cycle.
Where Is Power Query in Excel?
In current Excel versions, Power Query is integrated into the Data tab.
Look for groups such as:
- Get & Transform Data
- Queries & Connections
Microsoft’s current support documentation lists Power Query support across Excel for Microsoft 365, Excel 2024, Excel 2021, Excel 2019, and Excel 2016, with feature availability varying by platform and connector. Power Query is also available in Excel for Windows, Mac, and the web, although the exact feature set is not identical everywhere.
When Should You Use Power Query?
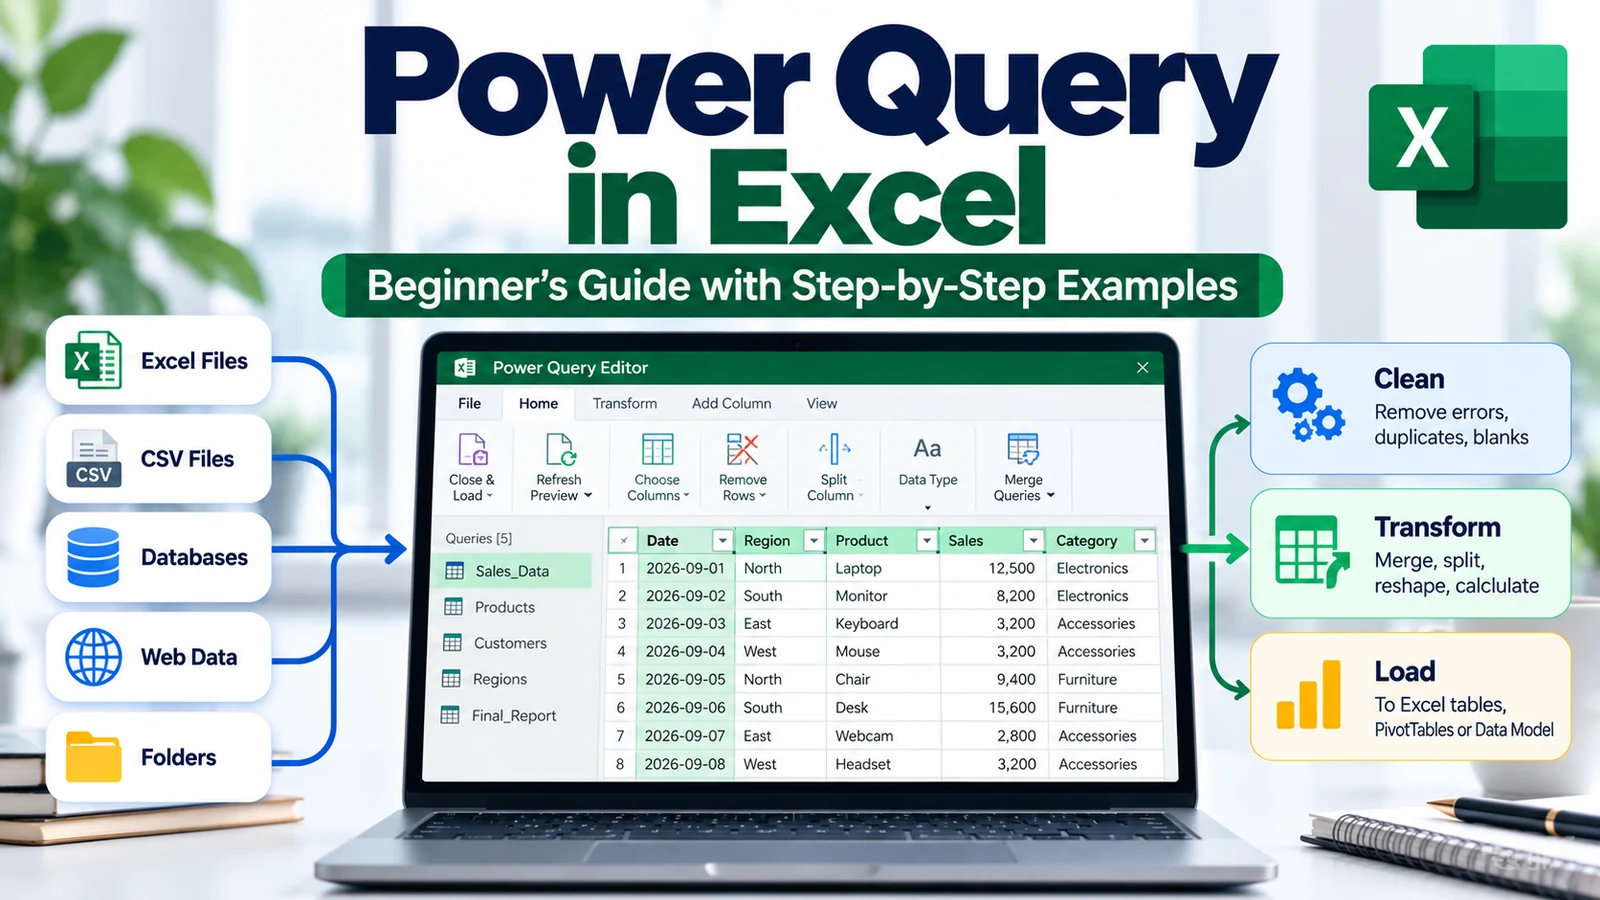
Power Query is especially useful when your challenge is not calculation but data preparation.
Typical situations include:
- You receive the same CSV export every week or month.
- You need to remove the same unnecessary columns repeatedly.
- You combine files from several teams or systems.
- You need consistent data types before analysis.
- You repeatedly split or merge text columns.
- You need to remove errors or blank rows.
- You want to combine tables using a common key.
- You need clean data before building PivotTables or dashboards.
If you are manually repeating the same cleanup steps, Power Query is often worth considering.
Power Query vs Excel Formulas vs PivotTables
| Tool | Best Used For | Example |
|---|---|---|
| Power Query | Importing, cleaning, reshaping and combining data | Combine monthly files and standardize columns |
| Formulas | Cell-level calculations, logic and lookups | Calculate variance or retrieve an owner |
| PivotTables | Interactive summarization and analysis | Summarize cost by region or status |
A strong Excel workflow often uses all three: Power Query prepares the data, formulas add calculations, and PivotTables summarize the result.
How to Start Power Query from an Excel Table
One of the easiest ways to learn Power Query is to start from data already inside Excel.
- Select a cell inside your data.
- Convert the range to an Excel Table if needed.
- Go to Data > From Table/Range.
- Excel opens the Power Query Editor.
Microsoft documents Data > From Table/Range as a standard way to create a query from an Excel table, named range, or supported dynamic array.
Understanding the Power Query Editor
The Power Query Editor is separate from the normal Excel grid. It provides a preview of the data and tools for transforming it.
The interface typically includes:
- Ribbon — commands for transformations.
- Data Preview — sample rows from the current query.
- Queries pane — the queries in the workbook.
- Query Settings — query name and Applied Steps.
Applied Steps
Every transformation you perform is recorded as a step.
For example:
Source
Promoted Headers
Changed Type
Removed Columns
Filtered Rows
Merged Queries
The sequence matters because each step builds on the result of the previous one.
Essential Power Query Transformations
1. Remove Unnecessary Columns
Raw exports often contain fields you do not need. Removing them early can make the query easier to understand.
Select the unwanted columns and choose:
Home > Remove Columns2. Change Data Types
Data types affect how Power Query interprets values.
Common types include:
- Text
- Whole Number
- Decimal Number
- Date
- Date/Time
- True/False
For example, a date stored as text may not behave correctly in later date calculations or grouping operations.
3. Filter Rows
Filtering lets you keep only the records relevant to the final dataset.
You might filter out:
- Cancelled transactions
- Blank rows
- Old periods
- Test records
- Specific categories
4. Remove Blank Rows
Blank rows can make imported files inconsistent. Power Query can remove empty records as part of the transformation sequence.
5. Replace Values
Replace Values is useful when a source uses inconsistent labels.
For example:
In progress → In Progress
Closed - Done → Closed
This can make later analysis more reliable.
6. Split a Column
Suppose one field contains:
Paris - FranceYou can split it by a delimiter such as:
- to create separate City and Country columns.
7. Merge Columns
The reverse operation can combine several fields into one.
For example:
Project ID + "-" + WorkstreamHow to Merge Queries
Merge Queries is similar in purpose to a database join or a lookup. It combines columns from two tables using one or more matching fields.
For example, imagine:
Table A — Projects
Project ID
Project Name
Owner
Table B — Budget
Project ID
Planned Budget
Actual Cost
You can merge the two queries using Project ID as the common key.
This is useful when data comes from separate systems but needs to be combined for reporting.
How to Append Queries
Append combines rows from similar datasets.
For example:
- January.xlsx
- February.xlsx
- March.xlsx
If the files have the same structure, you can append them into one consolidated dataset.
The result is conceptually:
January rows
+
February rows
+
March rows
=
One combined table
How to Combine Multiple Files from a Folder
One of Power Query’s strongest use cases is combining many files from the same folder.
For example, imagine that each business unit sends one monthly Excel file into a shared folder.
A typical workflow is:
- Go to Data > Get Data > From File > From Folder.
- Select the folder.
- Preview the files.
- Choose the combine/transform option.
- Power Query creates helper queries and a final combined result.
This can replace a large amount of manual copy-and-paste work when the files follow a consistent structure.
How to Load Power Query Results into Excel
After transforming the data, choose:
Home > Close & Loador:
Home > Close & Load To...Depending on the version and scenario, you can load the result to:
- An Excel Table
- A PivotTable
- A connection only
- The Data Model
Using Connection Only can be useful for staging queries that support other queries but do not need their own visible worksheet table.
How to Refresh Power Query Data
The real value of a query appears when the source changes.
If a monthly file is updated, you usually do not need to repeat the transformation sequence manually. Refreshing the query runs the saved steps against the latest source data.
Common options include:
- Refresh an individual query
- Refresh the loaded table
- Use Refresh All for multiple connections and queries
Microsoft also documents query management through the Queries pane, including grouping and refreshing supported queries.
Example: Monthly Project Status Consolidation
Imagine five project managers each send a workbook with the same columns:
Project
Workstream
Owner
Status
Due Date
Budget
Actual Cost
Risk Count
Every month, you need one portfolio report.
Manual Method
- Open every file.
- Copy the rows.
- Paste into a master workbook.
- Fix column types.
- Remove blank rows.
- Standardize status labels.
- Build the report again.
Power Query Method
- Connect to the folder containing the files.
- Combine them.
- Keep only required columns.
- Set correct data types.
- Standardize status values.
- Load the final table.
- Build a PivotTable or dashboard on top.
- Next month, replace the source files and refresh.
This is where Power Query changes Excel from a one-time spreadsheet into a more repeatable reporting process.
Power Query for Project Managers
Project managers can use Power Query when project reporting depends on data from several sources.
Portfolio Status Reporting
Combine standard project status files into one portfolio dataset.
Risk and Issue Consolidation
Append RAID logs from multiple workstreams and standardize categories before analysis.
Budget Reporting
Combine finance exports with project reference data and prepare a clean dataset for variance analysis.
Resource Analysis
Merge allocation data with team, role, or project reference tables.
Operational KPI Reporting
Import recurring CSV exports, clean them consistently, then refresh charts or PivotTables built on the result.
Common Power Query Mistakes
Changing the Source File Structure
Queries often depend on column names, file paths, and table structures. Unexpected source changes can break later steps.
Ignoring Data Types
Incorrect data types can cause errors when filtering, merging, calculating, or grouping.
Renaming Columns Too Late
If many later steps depend on column names, unnecessary renaming can make a query harder to maintain.
Loading Every Intermediate Query
Not every helper query needs a visible worksheet table. Use connection-only queries when appropriate.
Building One Very Complex Query
For larger workflows, smaller staging queries can be easier to understand and troubleshoot.
Forgetting Refresh Dependencies
If one query depends on another, understand the sequence before troubleshooting stale or unexpected results.
Power Query Best Practices
- Keep source files structurally consistent.
- Use clear query names.
- Set data types deliberately.
- Remove unnecessary columns early.
- Document unusual transformations.
- Use staging queries for complex workflows.
- Avoid manual edits inside the loaded output table.
- Refresh before publishing or presenting a report.
- Validate row counts after merges and appends.
- Keep a clean separation between raw data, transformed data, and reporting outputs.
Frequently Asked Questions About Power Query in Excel
Is Power Query the same as Get & Transform?
In Excel, Power Query is integrated through the Get & Transform experience. Microsoft commonly uses both terms when describing the feature.
Does Power Query replace Excel formulas?
No. Power Query is best suited to importing and transforming data. Excel formulas remain useful for calculations, logic, and interactive workbook models.
Does Power Query replace PivotTables?
No. Power Query prepares the data; PivotTables summarize and explore it. They work very well together.
Can Power Query combine multiple Excel files?
Yes. One common workflow is connecting to a folder containing similarly structured files and combining them into one query.
Can Power Query connect to CSV files?
Yes. CSV is one of the common file sources supported through Excel’s Get Data experience.
Do I need to learn the M language first?
No. Beginners can perform many useful transformations through the Power Query Editor interface. The underlying Power Query formula language, commonly called M, becomes useful when you need more advanced custom logic.
Can I refresh Power Query automatically?
Refresh behavior depends on the workbook, data source, connection settings, Excel platform, and environment. At minimum, learn how to refresh queries manually and verify that the latest source data is reflected before sharing a report.
Continue Learning
Continue building your Excel workflow from data preparation to analysis and reporting.
Excel Formulas & FunctionsBuild calculations, logic, and lookups on clean data.
PivotTables in ExcelSummarize and explore transformed datasets.
Conditional FormattingHighlight trends, risks, thresholds, and exceptions.
Remove DuplicatesClean duplicate records before deeper analysis.
Excel Drop-Down ListsControl inputs and improve data consistency.
Final Takeaway
Power Query in Excel is most valuable when data preparation is repetitive.
Start with a simple workflow: import one table, remove unnecessary columns, set the correct data types, filter the rows you need, load the result, and refresh it.
Once that becomes comfortable, move into merges, appends, folder-based consolidation, and reusable reporting workflows. The goal is not to make Excel more complicated; it is to stop repeating manual cleanup that Power Query can perform consistently for you.