

Finance for non-finance professionals is an essential management skill for anyone who leads teams, manages projects, controls budgets or makes investment decisions. You do not need to be an accountant, but you do need to understand what financial numbers mean and how they influence business decisions.
This practical guide will help you understand financial statements, budgets, cash flow, profitability, ROI and investment decisions without requiring specialist accounting knowledge.
Almost every management decision has a financial consequence. Hiring employees increases costs. Automation requires investment but may improve productivity. Moving applications to the cloud changes the cost model. Delaying a project can postpone expected benefits. Poor working-capital management can create cash problems even when a business is profitable.
For managers who want to strengthen these skills, the
ACCA guidance on finance for non-finance managers
highlights financial statements, budgeting, liquidity, risk and financial decision-making as important management capabilities.
The objective of this guide is simple: help managers use finance as a practical decision-making tool rather than treating it as something that belongs only to the finance department.
What Is Finance for Non-Finance Professionals?
Finance for non-finance professionals is the practical understanding of financial concepts needed to interpret business performance, manage resources and evaluate decisions.
The goal is not to turn managers into accountants.
Instead, financial literacy helps managers answer questions such as:
- Is our department performing within budget?
- Why is revenue growing while profit is falling?
- Why can a profitable company still experience cash problems?
- Should we invest in this technology project?
- What return should we expect from an investment?
- Should a cost be treated as CAPEX or OPEX?
- What is causing the difference between budget and actual results?
- Which financial indicators should management monitor?
Finance therefore becomes a management capability rather than simply a collection of accounting terms.
Why Finance for Non-Finance Professionals Matters to Managers
Managers constantly make decisions about resources.
A department leader decides whether another employee is needed. A project manager evaluates additional project expenditure. A technology leader chooses between maintaining legacy infrastructure and investing in modernization. A transformation leader needs to demonstrate that a program creates measurable business value.
Each of these decisions has financial implications.
Financial literacy improves decision-making
Without financial understanding, managers can focus too heavily on operational indicators while missing their financial consequences.
For example, a project might be delivered successfully according to scope and schedule but still fail to create the expected economic benefit.
Financial literacy encourages managers to connect:
Activities → Costs → Outputs → Business Outcomes → Financial Value
It improves communication with senior management
Executives often evaluate initiatives using financial questions:
- What will this cost?
- What value will it create?
- When will the benefits appear?
- What are the risks?
- What happens if we do nothing?
- What return should we expect?
A manager who can answer these questions clearly is better positioned to build a credible business case.
It improves collaboration with finance teams
Finance departments do more than record transactions. They support budgeting, forecasting, investment decisions, financial control and performance analysis.
Managers who understand basic financial concepts can work more effectively with finance professionals because both sides share a common language.
Finance vs Accounting: What Is the Difference?
Finance and accounting are closely connected, but they serve different purposes.
Accounting
Accounting records, classifies and reports financial transactions.
It helps answer questions such as:
- What revenue did we generate?
- What expenses did we incur?
- What assets and liabilities do we have?
- What happened financially during the period?
Finance
Finance uses financial information to help make decisions about resources, investments and future value.
It asks questions such as:
- Where should we invest?
- How should we finance an initiative?
- What return might an investment generate?
- What risks are associated with the decision?
- How should limited resources be allocated?
A simple way to remember the difference is that accounting helps explain financial performance and position, while finance uses financial information to support decisions about value and resources.
Finance for Non-Finance Professionals: Understanding Financial Statements
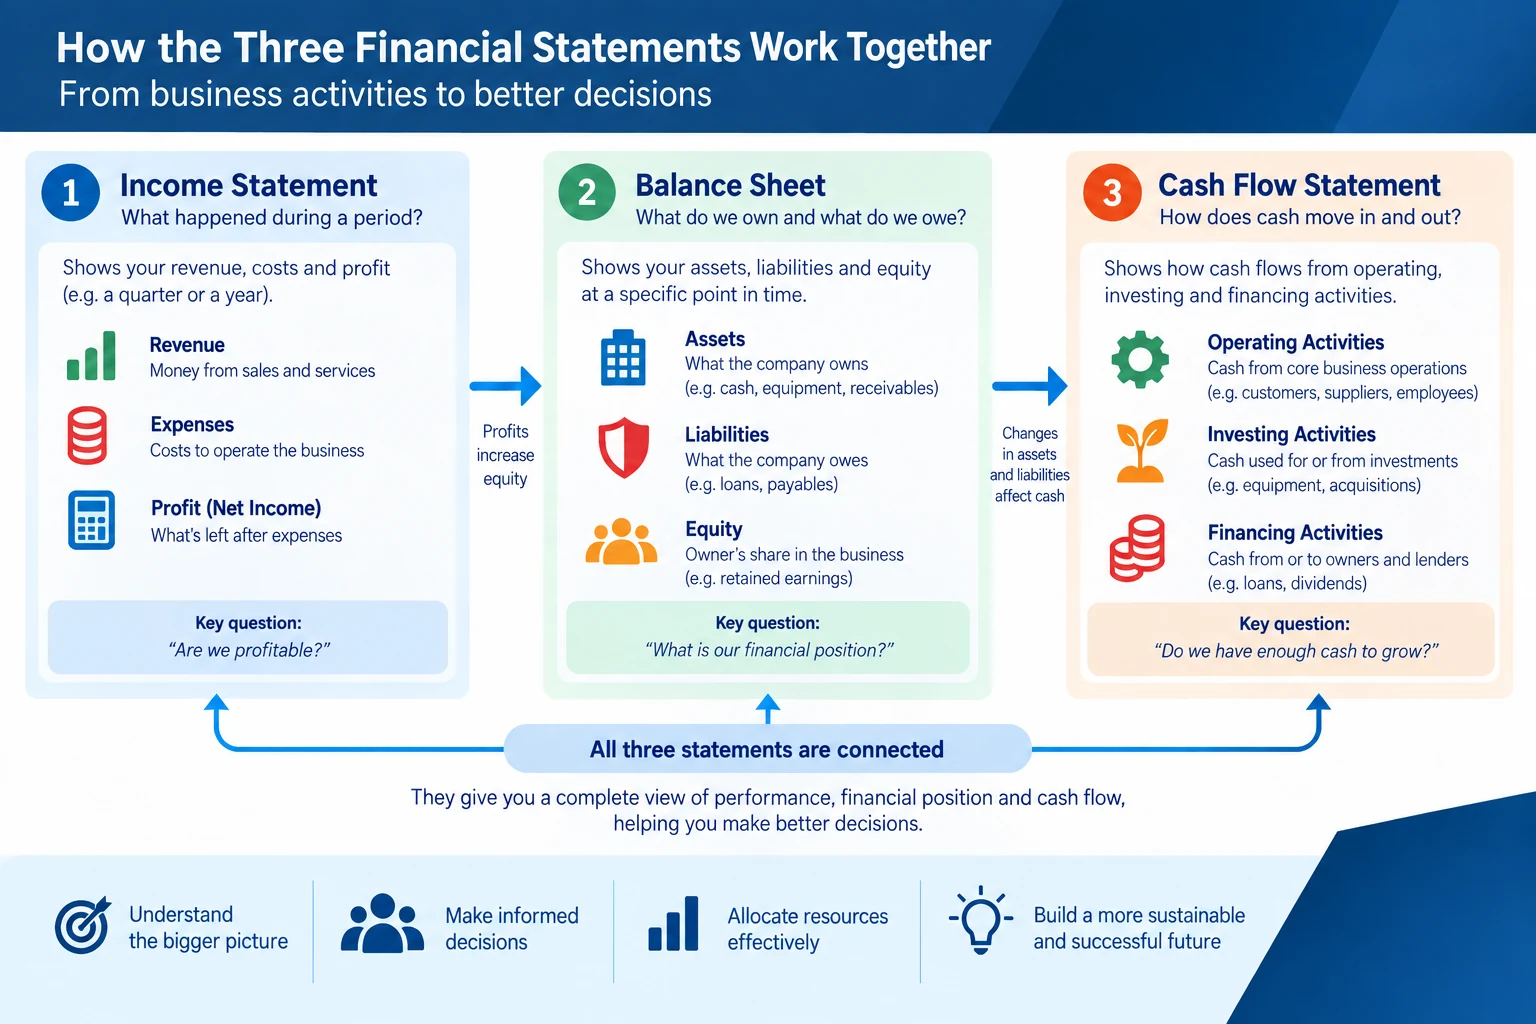
One of the foundations of finance for non-finance professionals is learning how the income statement, balance sheet and cash flow statement work together.
Managers do not need to memorize accounting standards, but they should understand what each statement tells them.
Harvard Business School also explains
how managers use financial statements
to understand business performance and support better decisions.
1. Income Statement
The income statement — often called the profit and loss statement or P&L — shows financial performance over a period.
In simplified form:
Revenue − Expenses = Profit
Suppose a business generates $5 million in revenue and incurs $4.2 million in total expenses.
Profit = $5,000,000 − $4,200,000 = $800,000
The income statement helps managers understand whether business activities are generating profit and which revenues and expenses contribute to the result.
2. Balance Sheet
The balance sheet shows the financial position of an organization at a specific point in time.
Its fundamental relationship is:
Assets = Liabilities + Equity
Assets are economic resources controlled by the business.
- Cash
- Receivables
- Inventory
- Buildings
- Equipment
Liabilities represent obligations.
- Supplier payments due
- Loans
- Other financial obligations
Equity represents the owners’ residual interest after liabilities are deducted from assets.
3. Cash Flow Statement
The cash flow statement explains how cash moves into and out of the organization.
Cash flows are generally grouped into:
- Operating activities — cash generated or used by normal business operations.
- Investing activities — purchases or sales of long-term assets and investments.
- Financing activities — borrowing, repayment, equity financing and related activities.
Managers should examine all three statements together because each provides a different view of the business.
Profit Is Not Cash
This is one of the most important concepts for non-finance managers.
A profitable business can still have cash-flow problems.
Imagine a company sells $100,000 of services to a customer.
The revenue may be recognized according to the applicable accounting rules, but suppose the customer will not pay for another 60 days.
The business may report revenue while the corresponding cash has not yet arrived.
Meanwhile, salaries, suppliers and other expenses may need to be paid.
This creates a fundamental distinction:
Profit measures economic performance according to accounting rules. Cash flow tracks actual movements of cash.
Managers should therefore avoid assuming that strong reported profit automatically means abundant cash.
Revenue, Costs, Margin and Profit
Managers should understand how revenue is converted into profit.
Revenue
Revenue represents income generated from the organization’s normal business activities.
Costs
Costs represent resources consumed in operating the business and delivering products or services.
Fixed costs
Fixed costs do not normally change directly with short-term production or sales volume within a relevant operating range.
Examples might include:
- Office rent
- Certain salaries
- Some software subscriptions
- Insurance
Variable costs
Variable costs change with the level of activity.
Examples can include:
- Materials
- Transaction fees
- Usage-based services
- Shipping associated with sales volume
Gross margin
A simplified gross margin percentage is:
Gross Margin % = Gross Profit ÷ Revenue × 100
If revenue is $1,000,000 and cost of goods sold is $600,000:
Gross Profit = $400,000
Gross Margin = 40%
Margins are useful because they allow managers to examine how effectively revenue is converted into profit at different levels of the business.
Break-Even Analysis for Managers
Break-even analysis helps managers estimate how much activity is required before total contribution covers fixed costs.
A common simplified formula is:
Break-Even Units = Fixed Costs ÷ Contribution Margin per Unit
Suppose:
- Fixed costs = $100,000
- Selling price per unit = $100
- Variable cost per unit = $60
Contribution per unit is:
$100 − $60 = $40
Break-even volume is therefore:
$100,000 ÷ $40 = 2,500 units
After approximately 2,500 units, additional contribution begins to exceed those fixed costs, assuming the underlying price and cost assumptions remain valid.
Budgeting and Forecasting for Managers
Budgeting is another important part of finance for non-finance professionals because it connects operational plans with the resources required to deliver them.
A budget translates plans into financial expectations.
It helps answer:
- What resources will we need?
- What revenue do we expect?
- What costs should we incur?
- How much can we invest?
- Where are financial constraints likely to appear?
Budgeting is not simply cost control
A budget should reflect priorities.
If digital transformation is strategically important, for example, budgets may need to support technology modernization, training, process redesign and change management.
The budget therefore connects strategy with resource allocation.
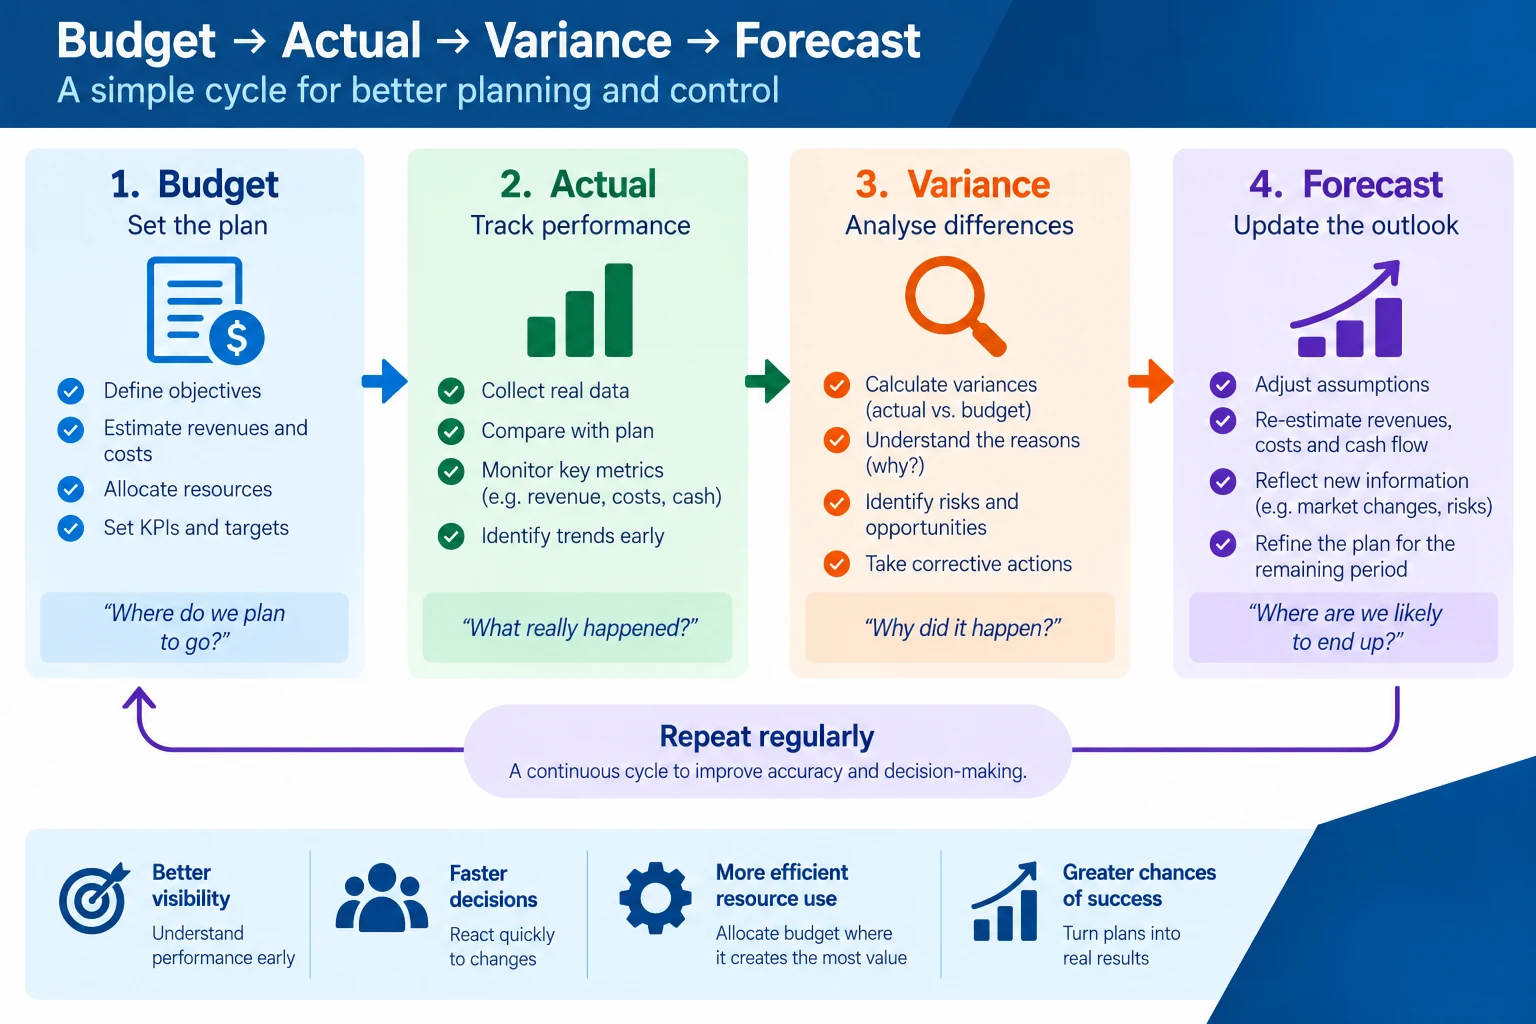
Budget vs actual
Managers should regularly compare actual results with the budget.
Suppose a project has:
- Budgeted cost: $500,000
- Actual cost: $575,000
The cost variance is:
$575,000 − $500,000 = $75,000 unfavorable variance
But identifying the variance is only the beginning.
A manager should determine why it occurred.
Possible causes include:
- Higher supplier prices
- Additional scope
- Implementation delays
- Incorrect assumptions
- Unexpected technical complexity
- Currency movements
- Additional resources
Good financial management explains the cause and business consequence rather than merely reporting that a variance exists.
Budgeting vs forecasting
A budget and a forecast are related but different.
A budget establishes an expected financial plan, usually for a defined period.
A forecast updates expectations based on the latest available information.
Imagine a department starts the year expecting to spend $2 million.
After six months, changing market conditions and project delays indicate the likely annual cost is now $2.3 million.
The original budget can remain $2 million while the latest forecast becomes $2.3 million.
This distinction allows management to compare the original plan with the current expected outcome.
Working Capital and Cash Flow
The Working capital is commonly calculated as:
Working Capital = Current Assets − Current Liabilities
For managers, the underlying operational components are often more useful than the formula alone.
Accounts receivable
Accounts receivable represents money customers owe the business.
Slow customer payments can reduce available cash even when reported revenue is strong.
Accounts payable
Accounts payable represents amounts the business owes suppliers and other parties.
Payment terms influence short-term cash requirements.
Inventory
Inventory can tie up cash until products are sold.
Too little inventory may create operational problems, while too much may consume cash and create obsolescence risk.
Working-capital management therefore requires balancing liquidity with operational requirements.
Financial Ratios Managers Should Understand
Financial ratios help managers interpret financial information, but they should never be evaluated in isolation.
Industry, business model, company maturity, accounting policies and historical trends all affect what represents an appropriate value.
Profitability ratios
These examine how effectively an organization generates profit.
- Gross margin
- Operating margin
- Net profit margin
- Return on assets
- Return on equity
Liquidity ratios
Liquidity ratios examine an organization’s ability to meet short-term obligations.
A common example is:
Current Ratio = Current Assets ÷ Current Liabilities
There is no universal “healthy” current ratio for every organization. Interpretation should consider industry characteristics, cash-flow stability, inventory characteristics, supplier terms and other business-specific factors.
Leverage ratios
These help assess how an organization uses debt and its ability to meet financing obligations.
Efficiency ratios
Efficiency ratios examine how effectively resources such as inventory, receivables or assets are being used.
The most useful analysis usually compares ratios with:
- Previous periods
- Budgets or targets
- Relevant industry benchmarks
- Comparable organizations
ROI and Investment Decisions for Managers
For managers, finance for non-finance professionals becomes particularly valuable when evaluating investments and comparing alternative uses of limited resources.
Return on investment is one of the most commonly used measures when discussing investments.
A simplified formula is:
ROI = (Financial Benefit − Investment Cost) ÷ Investment Cost × 100
Suppose an automation project costs $200,000 and is expected to generate $280,000 of measurable financial benefits over the period being evaluated.
Net benefit:
$280,000 − $200,000 = $80,000
ROI:
$80,000 ÷ $200,000 × 100 = 40%
That sounds attractive, but ROI alone does not tell the whole story.
Managers should also consider:
- When benefits will occur
- Risk and uncertainty
- Implementation costs
- Ongoing operating costs
- Alternative investments
- Strategic benefits
- Cost of capital
Managers interested in developing broader financial capability can also explore
finance skills for managers from Harvard Business School
.
CAPEX vs OPEX
Technology and project leaders frequently encounter the distinction between capital expenditure and operating expenditure.
CAPEX
Capital expenditure generally relates to spending that creates or improves an asset expected to provide benefits over multiple periods, subject to applicable accounting rules.
OPEX
Operating expenditure generally represents costs associated with normal ongoing business operations and is typically recognized as an expense according to the applicable accounting treatment.
The distinction matters because CAPEX and OPEX affect financial statements, budgets and investment decisions differently.
Managers should work with their finance teams rather than assuming a particular technology purchase automatically qualifies for one treatment or the other.
The Time Value of Money
One dollar received today is generally worth more than one dollar received several years from now because today’s money can potentially be invested and because future cash flows involve time and risk.
This principle is called the time value of money.
It becomes particularly important when comparing investments that generate costs and benefits over several years.
NPV: Net Present Value Explained Simply
Net Present Value converts expected future cash flows into today’s value using a discount rate and compares them with the investment required.
Conceptually:
NPV = Present Value of Future Cash Flows − Initial Investment
A positive NPV generally indicates that, based on the assumptions and discount rate used, the investment is expected to create value above the required return.
A negative NPV generally suggests the opposite.
NPV is useful because it accounts for the timing of cash flows rather than treating a dollar received several years from now as equivalent to a dollar received today.
IRR: Internal Rate of Return
The Internal Rate of Return is the discount rate at which an investment’s NPV equals zero.
Organizations can compare IRR with their required return or other investment alternatives.
IRR can be useful, but it should not automatically replace NPV or broader strategic analysis. Certain cash-flow patterns and comparisons between projects can make IRR less informative.
Payback Period
The payback period estimates how long it takes to recover the initial investment from expected cash inflows or savings.
Suppose an investment costs $300,000 and produces $100,000 of cash benefit annually.
A simplified payback period is:
$300,000 ÷ $100,000 = 3 years
Payback is intuitive but incomplete because the simple version ignores the time value of money and benefits occurring after the payback point.
It is best used alongside other measures rather than as the sole investment criterion.
How to Build a Financial Business Case
A strong business case connects a problem or opportunity to measurable outcomes.
A practical structure is:
Problem → Proposed Investment → Cost → Expected Benefits → Financial Return → Risks → Recommendation
1. Define the business problem
Explain what needs to change and why.
2. Establish the baseline
What does the current situation cost?
Consider:
- Operating expenditure
- Employee time
- Incidents
- Lost productivity
- Revenue opportunities
- Maintenance
- Customer impact
3. Estimate the investment
Include more than the purchase price.
Depending on the project, costs may include:
- Licensing
- Implementation
- Integration
- Migration
- Training
- Change management
- Ongoing operations
- Support
4. Quantify benefits
Benefits may include:
- Cost reduction
- Revenue growth
- Productivity improvement
- Reduced downtime
- Faster time to market
- Reduced risk exposure
Some benefits are easier to quantify than others. Avoid creating artificial precision for benefits that cannot be reliably measured.
5. Evaluate alternatives
A business case should not assume the proposed solution is automatically the best option.
Compare reasonable alternatives, including the cost and consequences of doing nothing.
6. Evaluate financial return
Depending on the organization and investment, consider ROI, NPV, IRR, payback and other relevant measures.
7. Include risks and assumptions
A transparent business case states the assumptions behind its numbers.
Decision-makers can then understand how sensitive the expected result is to changes in those assumptions.
Finance for Project Managers
The practical value of finance for non-finance professionals becomes clear when financial concepts are applied to projects, technology investments and transformation initiatives.
Project managers operate at the intersection of scope, time, resources, risk and value.
Financial literacy helps them understand the economic consequences of project decisions.
Understand the complete project cost
Project cost includes more than supplier invoices.
Managers may need to consider internal resources, licenses, infrastructure, migration, training, operations and ongoing support.
Manage financial variance
When actual costs diverge from budget, the project manager should understand why and determine the expected impact at completion.
Protect expected benefits
Completing deliverables is not the same as realizing business value.
A project can deliver its technical scope while the expected financial benefits fail to materialize.
For professionals moving from technical delivery toward broader project responsibility, see our guide to becoming an IT Project Manager.
Finance for Technology Leaders
Technology leaders increasingly need to explain technical decisions in business and financial terms.
“We need a new platform” is rarely a complete investment argument.
A stronger discussion connects technology to outcomes:
Technology Investment → Capability → Operational Change → Business Outcome → Financial Value
Cloud investments
Cloud can change the timing and structure of technology costs, but the financial case should consider migration, consumption, operations, architecture, skills and governance — not simply compare hardware with a cloud subscription.
Automation
An automation business case should consider implementation cost, maintenance, process volume, time saved, error reduction and whether the released capacity creates measurable value.
Artificial intelligence
AI investments should be connected to specific use cases and measurable outcomes rather than justified by technology enthusiasm alone.
Potential value can come from productivity, automation, improved decisions, better customer experiences or new products and services.
Cybersecurity
Cybersecurity investments are different from straightforward revenue-generating projects.
Their value often involves risk reduction, business continuity, regulatory requirements and protection of critical assets.
Managers should therefore avoid forcing every security investment into an overly simplistic ROI calculation.
Finance and Digital Transformation
Digital transformation requires investment.
Organizations may invest in cloud platforms, networks, AI, automation, cybersecurity, applications, data platforms, employee skills and organizational change.
The financial challenge is determining which investments create meaningful value.
This requires connecting three perspectives:
Technology + Team + Transformation
Technology creates new capabilities.
Teams use those capabilities to change how work is performed.
Transformation connects technology and people to business outcomes.
Financial analysis helps determine whether those outcomes justify the resources invested.
Common Financial Mistakes Non-Finance Managers Make
1. Confusing revenue with profit
Higher revenue does not automatically mean higher profit. Costs matter.
2. Confusing profit with cash
Reported profit and cash availability are not the same thing.
3. Looking only at the initial price
The lowest purchase price may not represent the lowest total cost over the life of an investment.
4. Treating the budget as a prediction that cannot change
Budgets establish plans. Forecasts should reflect changing information.
5. Using financial ratios without context
A ratio that is appropriate in one industry or business model may not be appropriate in another.
6. Presenting benefits without assumptions
A business case becomes unreliable when benefit estimates are disconnected from explicit assumptions.
7. Ignoring the cost of doing nothing
Maintaining the current situation is also a decision and may have financial consequences.
8. Measuring only costs
Cost management matters, but sustainable decision-making also considers value, risk, customer outcomes and strategic capability.
Practical Example: Evaluating an Automation Investment
Consider a company evaluating automation for a repetitive operational process.
The current process requires substantial manual effort and generates avoidable errors.
Current annual cost
- Manual processing: $250,000
- Error correction: $50,000
- Total relevant annual cost: $300,000
Proposed solution
- Implementation: $180,000
- Training and change management: $20,000
- Initial investment: $200,000
- Annual operating cost: $40,000
Expected annual measurable benefit
Suppose automation reduces relevant manual and error-related costs from $300,000 to $140,000 per year, including the new operating cost.
Estimated annual benefit:
$300,000 − $140,000 = $160,000
A simple payback estimate would therefore be:
$200,000 ÷ $160,000 = 1.25 years
But management should not stop there.
The business case should test assumptions:
- Will the expected workload reduction actually occur?
- Can released employee capacity be redeployed productively?
- Are integration costs included?
- Will maintenance costs increase?
- How reliable is the automation?
- Are there operational or cybersecurity risks?
- What happens if transaction volume changes?
This demonstrates why financial analysis is more than calculating a formula. The quality of the decision depends heavily on the quality of the assumptions.
15-Minute Financial Decision Review
Before approving a meaningful investment, budget change or cost-saving initiative, use one real decision and review it quickly from six financial angles.
- 0–3 min — Confirm the full cost. Include implementation, integration, migration, training, support and ongoing operating cost rather than only the purchase price.
- 3–5 min — Check cash timing. Identify when cash leaves the business and when the expected financial benefits actually arrive.
- 5–8 min — Test the benefits. Separate measurable financial benefits from strategic or qualitative benefits, and confirm the baseline used.
- 8–11 min — Challenge the assumptions. Ask what happens if volume, adoption, pricing, delivery timing or operating costs differ from the plan.
- 11–13 min — Compare alternatives. Include another solution, a smaller pilot and the financial consequence of doing nothing.
- 13–15 min — Decide the next step. Record the owner, the evidence still required and the date when the financial case will be reviewed again.
Use a simple decision output: PROCEED / PILOT FIRST / REWORK THE BUSINESS CASE / ESCALATE FOR FINANCE REVIEW.
This review is not a substitute for formal financial approval. It helps non-finance managers identify weak assumptions before a proposal reaches that stage.
Finance Cheat Sheet for Managers
Revenue: Income generated from normal business activities.
Profit: Revenue remaining after relevant expenses are deducted.
Cash Flow: Movement of cash into and out of the business.
Assets: Economic resources controlled by the organization.
Liabilities: Financial obligations of the organization.
Equity: Residual interest after liabilities are deducted from assets.
Gross Margin: Gross profit expressed relative to revenue.
Working Capital: Current assets minus current liabilities.
ROI: A simplified measure comparing investment benefit with investment cost.
NPV: The present value of expected future cash flows minus the investment required.
IRR: The discount rate at which an investment’s NPV equals zero.
Payback: Estimated time required to recover an initial investment.
CAPEX: Capital expenditure associated with qualifying long-term assets or improvements, subject to accounting rules.
OPEX: Operating expenditure associated with ongoing business operations.
Budget: Financial plan for a defined period.
Forecast: Updated expectation based on current information.
Frequently Asked Questions About Finance for Non-Finance Professionals
What is finance for non-finance professionals?
Finance for non-finance professionals teaches managers and other professionals how to understand financial information and use it in business decisions without requiring them to become accountants.
What financial skills should every manager have?
Managers should understand the income statement, balance sheet and cash flow statement; budgeting and forecasting; costs and margins; cash flow; financial ratios; and common investment measures such as ROI, NPV and payback.
Why is finance important for project managers?
Projects consume resources with the expectation of producing outcomes. Financial literacy helps project managers understand budgets, costs, variances, investment assumptions and whether expected business benefits justify project expenditure.
What is the difference between profit and cash flow?
Profit measures financial performance according to accounting rules, while cash flow reflects actual cash entering and leaving the business. A company can therefore report profit while experiencing cash-flow pressure.
What is ROI?
Return on investment compares the financial benefit of an investment with its cost. It is useful for communicating investment performance but should be considered alongside timing, risk and other financial and strategic factors.
What is the difference between ROI and NPV?
ROI provides a percentage-based comparison of benefit and cost. NPV discounts future cash flows into today’s value, making it particularly useful when an investment generates costs and benefits over multiple periods.
What is the difference between CAPEX and OPEX?
CAPEX generally relates to qualifying expenditure that creates or improves longer-term assets, while OPEX generally relates to ongoing operating expenses. Exact classification depends on the transaction and applicable accounting rules.
Do managers need to understand accounting?
Managers do not normally need the technical accounting expertise of professional accountants, but they should understand enough accounting to interpret financial statements, budgets, costs and performance indicators and to collaborate effectively with finance teams.
Conclusion: Finance Is a Management Skill
Ultimately, finance for non-finance professionals is not about becoming an accountant. It is about becoming a manager who can connect operational decisions with financial and business outcomes.
Managers make decisions about people, projects, technology, suppliers, investments and priorities. Every one of those decisions can have financial consequences.
Start with the fundamentals: understand the income statement, balance sheet and cash flow statement. Learn the difference between profit and cash. Understand costs, margins, budgets and forecasts. Then develop the ability to evaluate investments through ROI, NPV, payback, risk and business outcomes.
For technology and transformation leaders, the final step is particularly important: stop presenting technology only as a technical requirement and start connecting investment to measurable organizational value.
That is where financial literacy becomes a genuine leadership capability.
Continue Learning
Explore these related guides to strengthen your project, performance and leadership skills.