
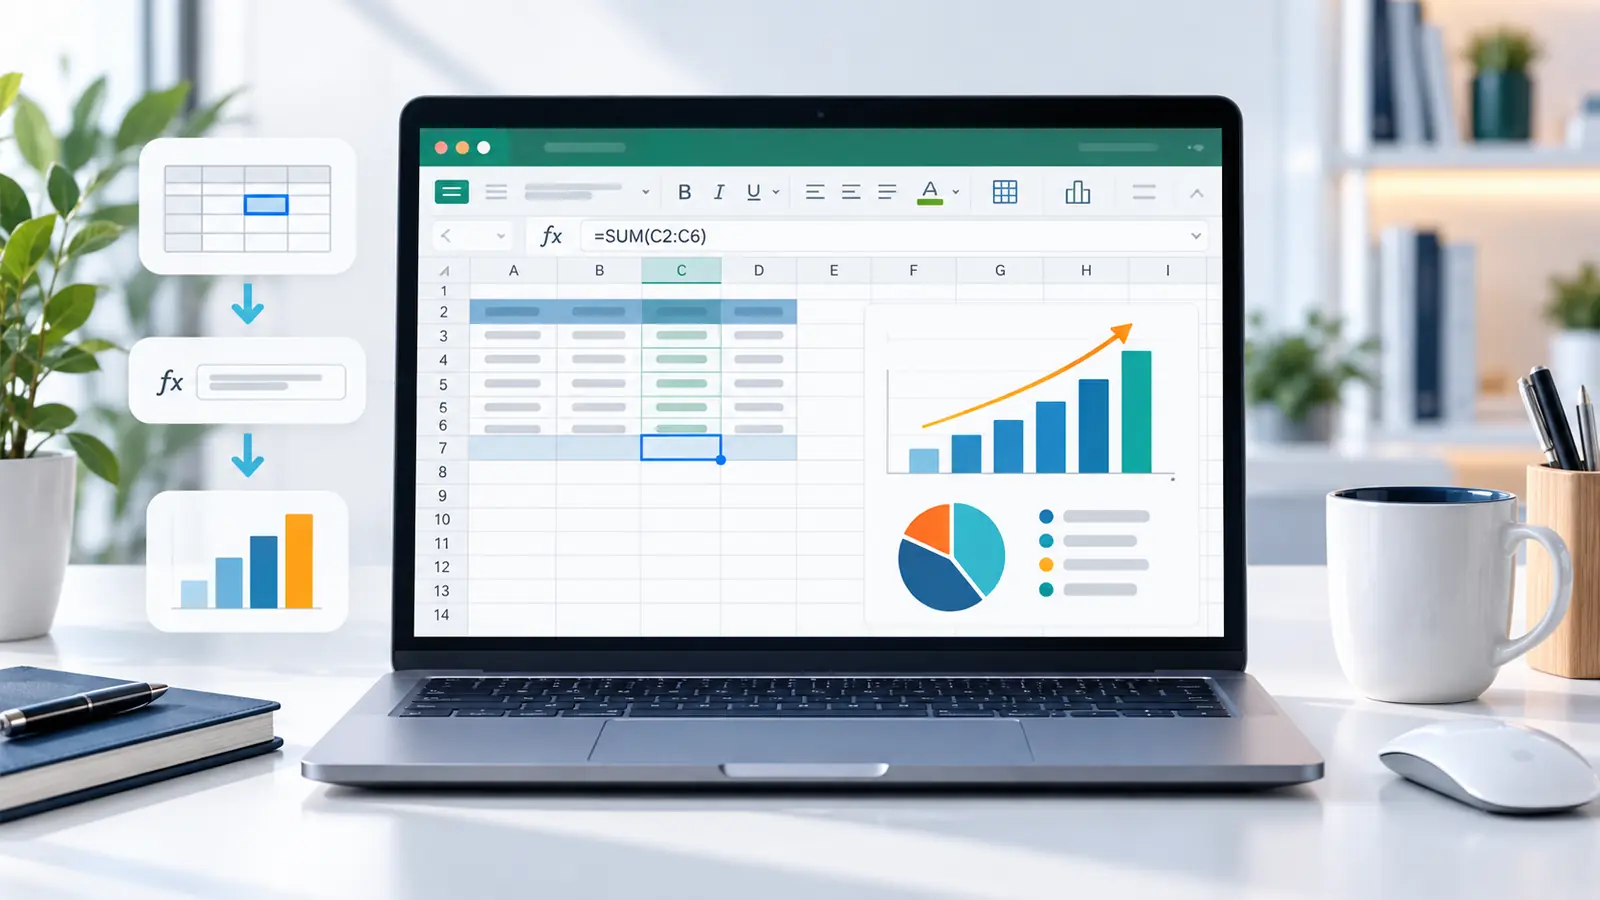
New to Excel? This beginner-friendly guide will teach you the essential Excel skills you need to start creating spreadsheets, organizing information and performing calculations with confidence.
You will learn how workbooks and worksheets work, how to enter and format data, how Excel formulas work, how to use essential functions, and how to sort, filter and organize your information.
You do not need previous Excel experience.
Beginner roadmap: Workbook → Worksheet → Cells → Data → Formatting → Formulas → Functions → References → Tables → Sort & Filter → Charts.
By the end of this guide, you should be able to create a simple spreadsheet from scratch and understand the foundations needed for more advanced Excel skills.
This guide focuses primarily on Microsoft 365 and recent desktop versions of Excel. Menu locations and keyboard shortcuts may vary slightly between Windows, macOS and Excel for the web.
Excel Basics
Microsoft Excel is spreadsheet software used to organize, calculate, analyze and present information. If you are completely new to the application, Microsoft’s official Basic tasks in Excel guide is a useful companion reference.
Excel organizes information inside a grid made from rows and columns.
Where a row and column meet, you have a cell.
A cell can contain information such as:
- Text
- Numbers
- Dates
- Percentages
- Formulas
For example, you might use Excel to create:
- A personal budget
- A project task list
- An expense tracker
- A student grade sheet
- An inventory list
- A schedule
- A simple report
Excel can become extremely sophisticated, but you do not need advanced features to start getting value from it.
Understanding Excel Workbooks and Worksheets
Two terms every beginner should understand are workbook and worksheet.
What Is an Excel Workbook?
An Excel file is called a workbook.
For example:
Monthly-Budget.xlsxis a workbook.
What Is an Excel Worksheet?
A workbook contains one or more worksheets, also commonly called sheets.
You might have one workbook called:
Annual-Budget.xlsxcontaining worksheets called:
January
February
March
Summary
This allows related information to stay together without placing everything on one enormous sheet.
Workbook vs Worksheet
| Term | Meaning | Example |
|---|---|---|
| Workbook | The complete Excel file | Annual-Budget.xlsx |
| Worksheet | One sheet inside the workbook | January |
| Cell | Intersection of a row and column | B5 |
Understanding Rows, Columns and Cells
An Excel worksheet is made from rows and columns.
Columns
Columns run vertically and use letters:
A
B
C
D
...
Rows
Rows run horizontally and use numbers:
1
2
3
4
...
Cells
Every cell has an address based on its column and row.
For example:
A1means:
Column A + Row 1
Similarly:
C7means:
Column C + Row 7
Cell references become very important when you start creating formulas.
Understanding the Excel Interface
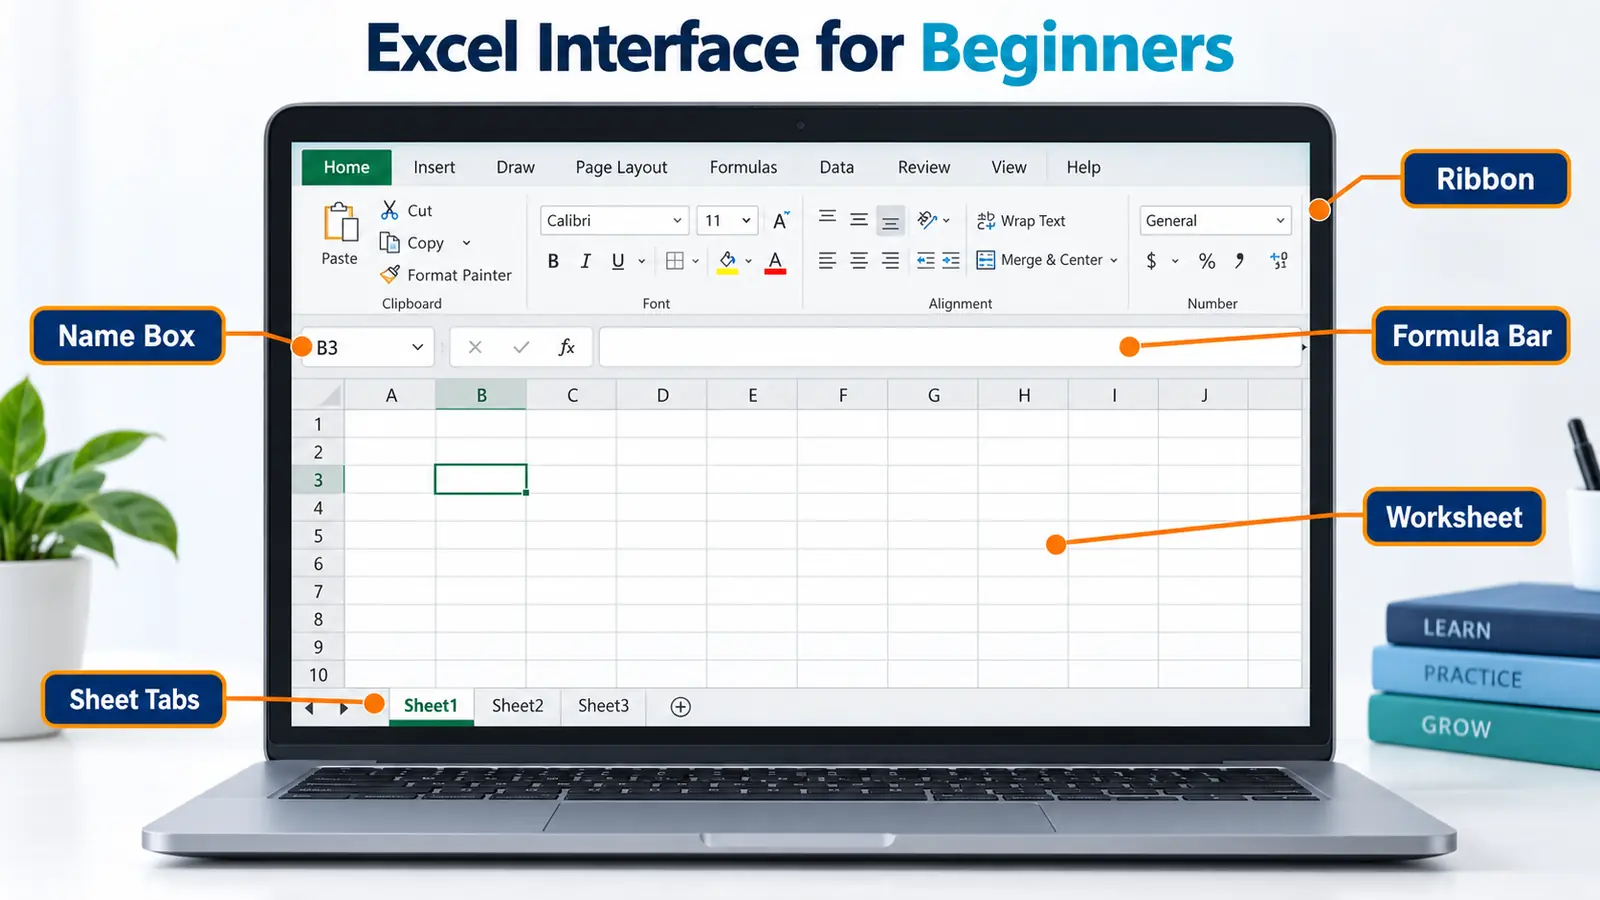
When you open Excel, you will see several important areas.
The Ribbon
The Ribbon contains Excel commands organized into tabs.
Common tabs include:
- Home
- Insert
- Page Layout
- Formulas
- Data
- Review
- View
The Formula Bar
The Formula Bar displays the content or formula of the selected cell.
If a cell contains:
=A1+B1you can see that formula in the Formula Bar when the cell is selected.
The Name Box
The Name Box displays the address of the active cell.
If you select cell D10, the Name Box displays:
D10Worksheet Tabs
Worksheet tabs appear near the bottom of the workbook and allow you to switch between sheets.
You can also rename sheets so their purpose is clear.
Instead of:
Sheet1
Sheet2
Sheet3
use descriptive names such as:
Sales
Expenses
Summary
How to Create a New Excel Workbook
To create a blank workbook in desktop Excel:
- Open Excel.
- Select File → New.
- Select Blank workbook.
You can now begin entering data.
Excel also offers ready-made templates. If you want to learn more about those, see our complete guide to Excel templates.
Entering and Formatting Data in Excel
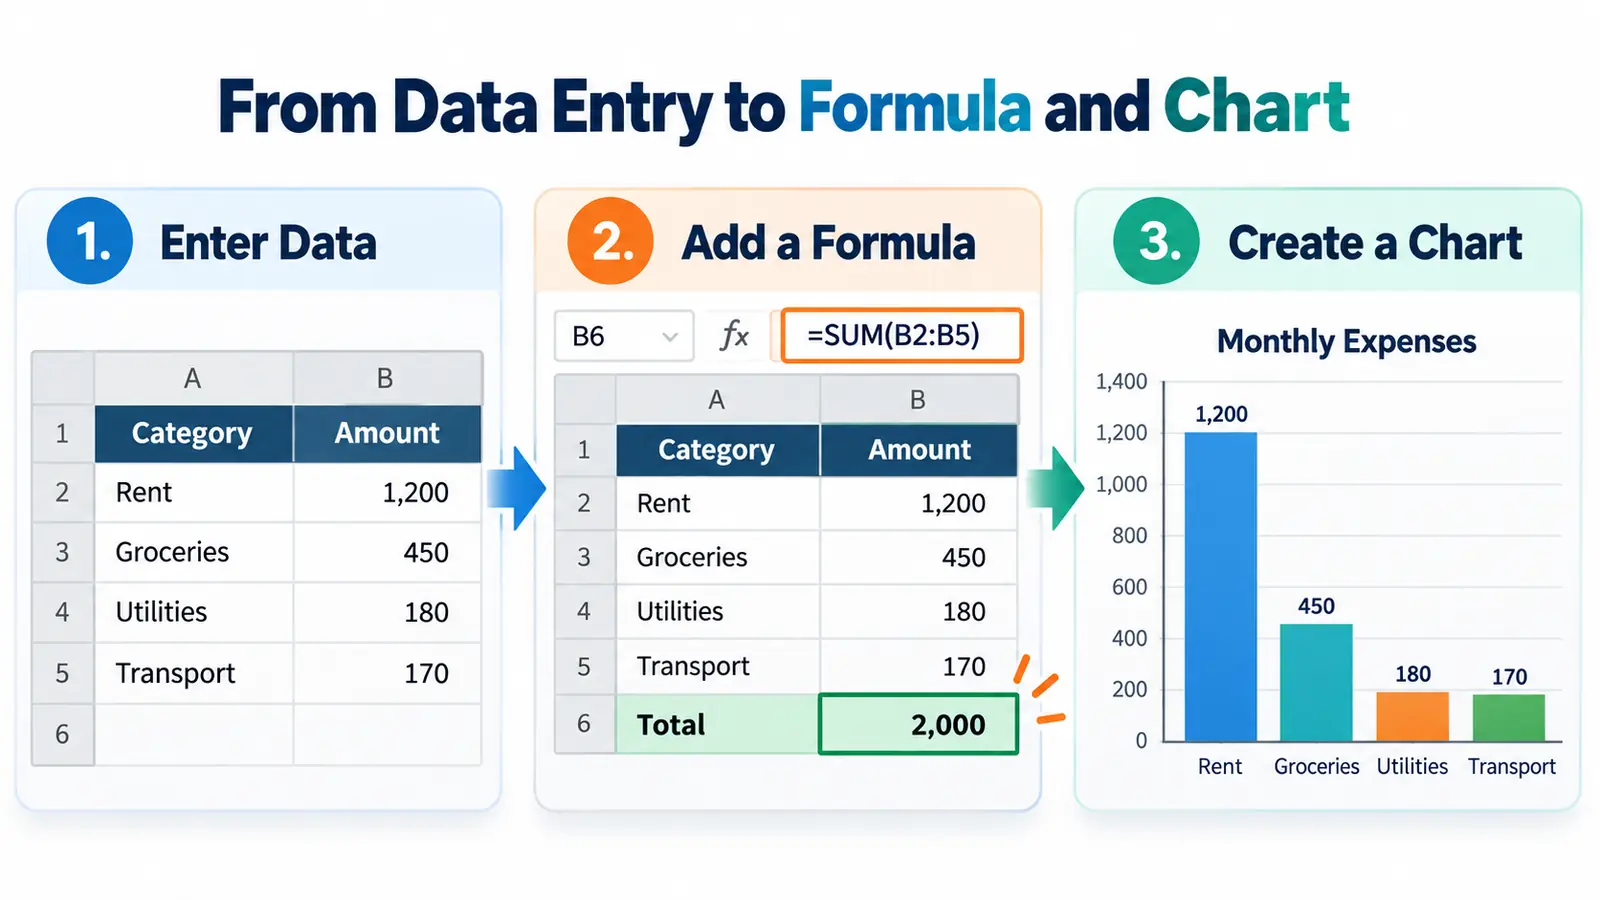
Entering information is simple.
- Select a cell.
- Type the information.
- Press Enter.
For example, select A1 and type:
ProductSelect B1 and type:
PriceThen enter:
A2: Keyboard
B2: 30

A3: Mouse
B3: 20

A4: Monitor
B4: 200
You have created a simple dataset.
Text, Numbers and Dates in Excel
Excel handles different types of information differently.
Text
Examples:
Keyboard
Finance
Project A
Numbers
Examples:
100
25.5
3000
Dates
Excel can recognize and format dates.
How dates are displayed can depend on your regional settings and selected number format.
Percentages
Excel can display decimal values as percentages.
For example, a value representing one half can be displayed as:
50%Understanding the difference between a cell’s underlying value and its displayed format becomes important as your spreadsheets become more sophisticated.
How to Edit Cell Content
If you enter something incorrectly, you do not need to delete the entire worksheet.
Select the cell and edit its contents using the Formula Bar or edit directly in the cell.
You can also replace the existing value by selecting the cell and typing new content.
How to Clear a Cell
Select the cell and press:
DeleteThis normally clears its contents.
Be aware that clearing content and deleting an entire cell, row or column are different operations.
How to Select Cells and Ranges
A single cell might be:
A1A group of neighboring cells is called a range.
For example:
A1:A10means cells A1 through A10.
And:
A1:C10means the rectangular area from A1 through C10.
Ranges are used constantly in formulas, formatting, charts and data analysis.
How to Insert Rows and Columns
As your worksheet grows, you may need additional space.
To insert a row or column, select the appropriate row or column heading, then use the Insert command available from the Ribbon or context menu.
After structural changes, it is a good habit to verify important formulas and charts to ensure they still reference the intended data.
How to Adjust Column Width
If a value does not fit inside a column, increase the column width.
You can drag the boundary between column headings.
You can also use AutoFit by double-clicking the boundary between column headings in desktop Excel.
How to Adjust Row Height
Rows can also be resized by dragging the boundary between row numbers.
This is useful when cells contain wrapped text or larger content.
Basic Formatting in Excel
Formatting changes how information appears without necessarily changing the underlying value.
Common formatting options include:
- Bold
- Italic
- Font size
- Alignment
- Borders
- Cell fill
- Currency
- Percentage
- Date formats
- Decimal places
Example
Suppose B2 contains:
1250You can format it as currency so it displays according to the currency and regional format you choose.
The underlying number remains available for calculations.
Number Formatting vs Changing the Value
This distinction is important.
Formatting normally changes how a value is displayed, not necessarily the underlying value itself.
This is why number formatting is preferable to manually typing symbols or descriptive text into cells that should remain numeric.
How to Use Copy, Cut and Paste
Three fundamental spreadsheet operations are:
Copy:
Ctrl + CCut:
Ctrl + XPaste:
Ctrl + VThese shortcuts can dramatically speed up spreadsheet work.
What Is Autofill in Excel?
Excel can help extend values and formulas using the fill handle.
For example, if you create a formula in one row, you can often drag the fill handle to copy that formula into neighboring rows.
Excel adjusts relative references as the formula is copied.
This brings us to one of the most important beginner concepts: formulas.
Excel Formulas and Functions
A formula tells Excel to calculate something. For a deeper reference, see Microsoft’s official overview of formulas in Excel.
Excel formulas begin with an equals sign:
=For example:
=2+3returns:
5But Excel becomes much more useful when formulas refer to cells.
Your First Excel Formula
Suppose:
A1 = 10
B1 = 5
In C1 enter:
=A1+B1Excel returns:
15If you later change A1, Excel recalculates the formula.
This is one of the fundamental advantages of using cell references instead of manually calculating every result.
Basic Excel Calculation Operators
| Operation | Operator | Example |
|---|---|---|
| Addition | + | =A1+B1 |
| Subtraction | – | =A1-B1 |
| Multiplication | * | =A1*B1 |
| Division | / | =A1/B1 |
| Exponentiation | ^ | =A1^2 |
Formula vs Function in Excel
A formula is an expression you create.
For example:
=A1+B1A function is a predefined calculation provided by Excel.
For example:
=SUM(A1:A10)Functions make common calculations much easier.
Essential Excel Functions for Beginners
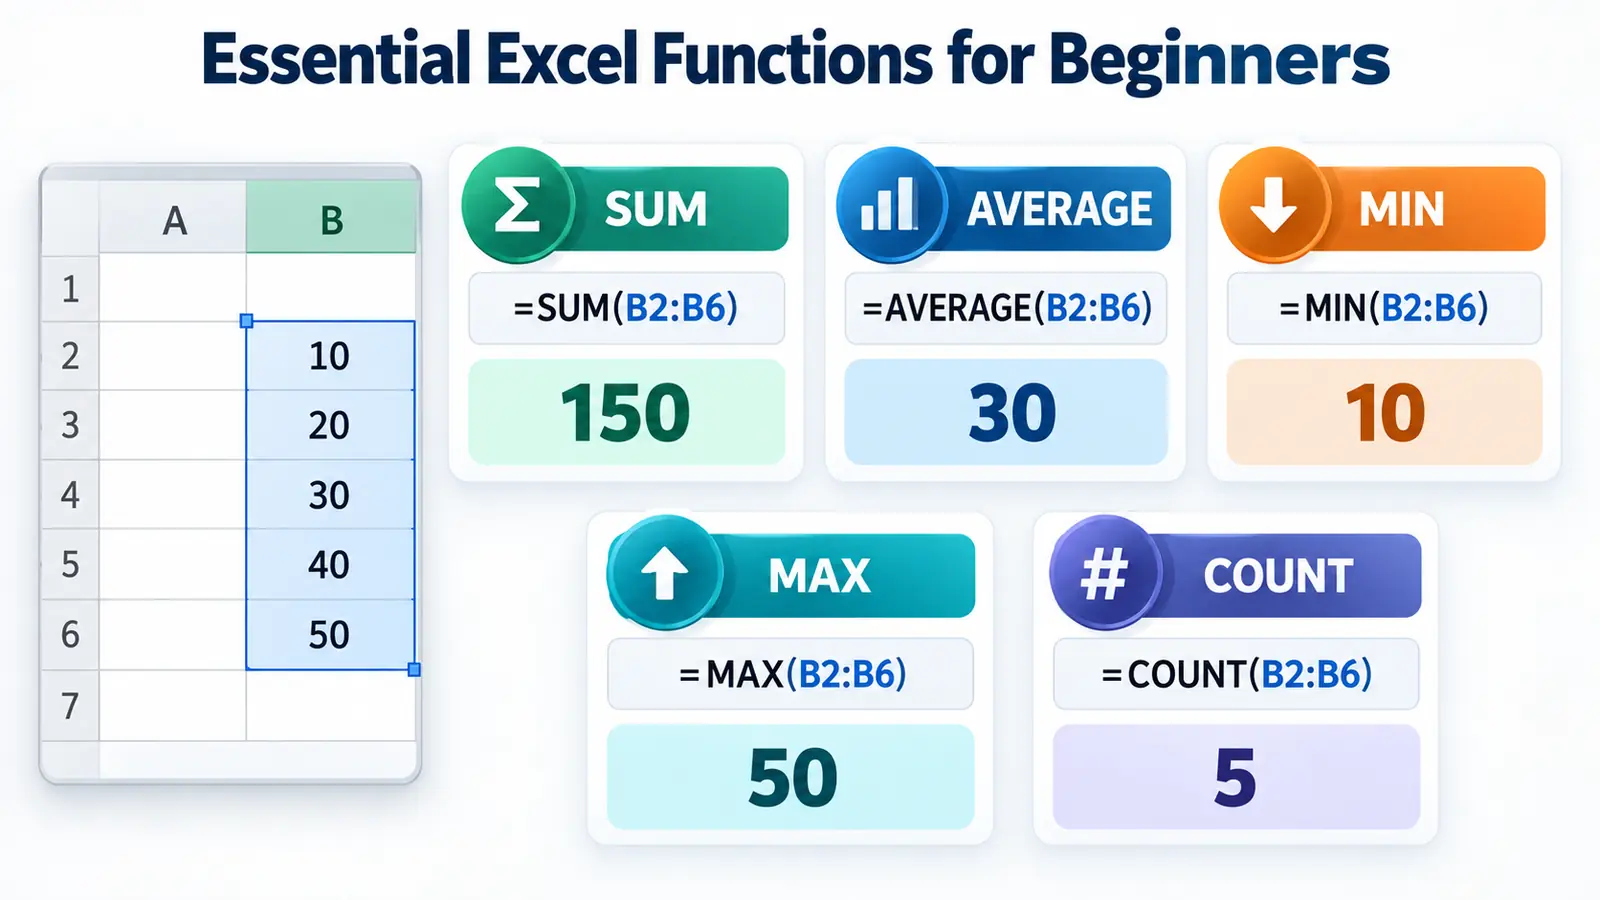
You do not need to memorize hundreds of functions.
Start with a small set that you can use confidently.
SUM
Adds numbers.
=SUM(B2:B10)AVERAGE
Calculates the arithmetic mean of numeric values.
=AVERAGE(B2:B10)MIN
Returns the smallest numeric value.
=MIN(B2:B10)MAX
Returns the largest numeric value.
=MAX(B2:B10)COUNT
Counts cells containing numbers within the specified arguments.
=COUNT(B2:B10)COUNTA
Counts non-empty cells.
=COUNTA(A2:A10)Using AutoSum
Excel provides an AutoSum command for quickly inserting a SUM calculation.
If your numbers are in:
B2:B10select an appropriate cell below or beside the values and use AutoSum.
Excel attempts to identify the range and insert a SUM formula.
Always verify that the selected range is the one you intended.
Cell References and Practical Formulas
Consider this formula in C2:
=A2+B2If you copy it down one row to C3, Excel normally adjusts it to:
=A3+B3This is called a relative reference.
The reference changes relative to the formula’s new location.
Understanding Absolute Cell References
Sometimes you do not want a reference to move when a formula is copied.
Suppose cell E1 contains a tax rate that every calculation should use.
You might write:
=B2*$E$1The dollar signs make E1 an absolute reference.
When the formula is copied down, the reference to E1 remains fixed.
Relative vs Absolute References
| Reference | Type | Behavior When Copied |
|---|---|---|
A1 |
Relative | Row and column can change |
$A$1 |
Absolute | Row and column remain fixed |
$A1 |
Mixed | Column fixed, row can change |
A$1 |
Mixed | Row fixed, column can change |
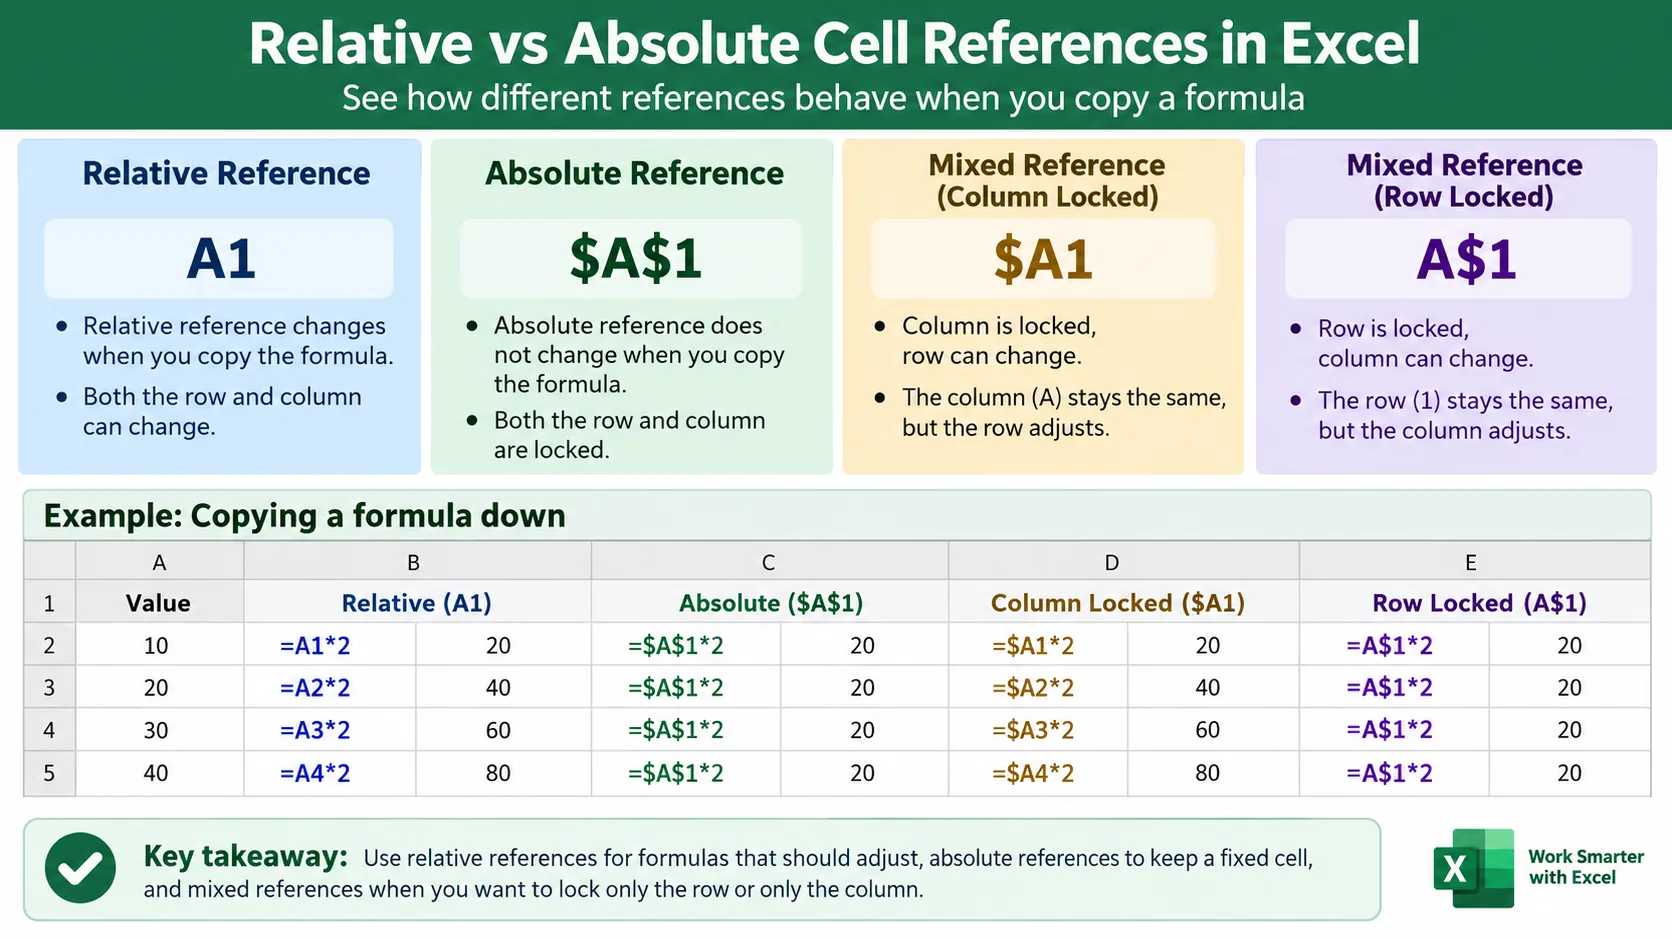
For beginners, understanding relative and absolute references is more valuable than memorizing dozens of advanced functions.
Example: Build a Simple Expense Tracker
Let’s combine what you have learned.
Create these headings:
| Date | Category | Description | Amount |
|---|---|---|---|
| 1 Sep | Transport | Bus | 10 |
| 2 Sep | Food | Lunch | 15 |
| 3 Sep | Supplies | Notebook | 8 |
Below the Amount column, calculate the total using:
=SUM(D2:D4)Then format the Amount column using an appropriate currency format.
You have now combined:
- Data entry
- Headers
- Number formatting
- Cell ranges
- A formula
- The SUM function
Organizing and Analyzing Data
An Excel Table is more than simply putting borders around cells.
It is a structured Excel feature for organizing related data.
For example:
| Task | Owner | Status |
|---|---|---|
| Review plan | Alex | Complete |
| Update report | Sam | In Progress |
| Approve design | Jordan | Not Started |
Turning structured data into an Excel Table can make it easier to:
- Sort
- Filter
- Apply consistent formatting
- Work with growing datasets
How to Create an Excel Table
Microsoft also provides an official Create and format tables reference if you want to compare the steps with the latest Excel interface.
One common method is:
- Select your dataset.
- Choose Insert → Table.
- Confirm the selected range.
- Indicate whether the data has headers.
- Select OK.
A common Windows keyboard shortcut is:
Ctrl + TYour data becomes a structured Excel Table.
How to Sort Data in Excel
Sorting changes the order in which data appears.
You might sort:
- Names alphabetically
- Dates from oldest to newest
- Sales from largest to smallest
- Priorities in a defined order
For a simple sort:
- Select a cell in the column you want to sort.
- Go to the Data tab.
- Choose the appropriate ascending or descending sort.
When working with related columns, make sure the entire dataset remains together rather than sorting one column independently in a way that disconnects values from their rows.
How to Filter Data in Excel
Filtering temporarily hides rows that do not meet your selected criteria.
For example, suppose your task list contains:
- Not Started
- In Progress
- Completed
You could filter the Status column so only:
In Progresstasks remain visible.
A common process is:
- Select your dataset.
- Go to Data → Filter.
- Select the filter arrow in a column heading.
- Choose the values or criteria you want to display.
Filtering does not normally delete the hidden rows. It changes which rows are currently displayed.
Sort vs Filter
| Feature | What It Does |
|---|---|
| Sort | Rearranges the order of data |
| Filter | Temporarily displays only data matching selected criteria |
Charts, Navigation and Everyday Excel Tasks
Charts help turn numbers into visual information.
Suppose you have:
| Month | Sales |
|---|---|
| January | 1000 |
| February | 1400 |
| March | 1250 |
Select the data and use the Insert tab to choose an appropriate chart.
Common chart types include:
- Column
- Bar
- Line
- Pie
Do not choose a chart simply because it looks attractive. Choose one that makes the underlying information easier to understand.
When Should a Beginner Use a Chart?
Charts are useful when the visual comparison communicates something more clearly than a table alone.
For example:
- A line chart can show change over time.
- A column chart can compare categories.
- A bar chart can make category comparisons easier when labels are long.
Keep beginner charts simple and clearly labeled.
How to Freeze Rows and Columns
Large worksheets become difficult to read when headers disappear as you scroll.
Excel’s Freeze Panes feature can keep selected rows or columns visible.
You can find the relevant options under:
View → Freeze Panes
For example, freezing the top row can keep your column headings visible while you scroll through a long list.
How to Find Information in Excel
Use:
Ctrl + Fto open Find and search for information in your workbook.
This becomes very useful when working with larger worksheets.
How to Save an Excel Workbook
Save your work regularly.
A common shortcut is:
Ctrl + SFor a new workbook, Excel will ask you to choose a filename and storage location.
Normal Excel workbooks commonly use the:
.xlsxfile extension.
How to Print an Excel Worksheet
Before printing, use Print Preview.
Go to:
File → Print
or use:
Ctrl + PCheck:
- Orientation
- Margins
- Scaling
- Page breaks
- Print area
Spreadsheets can become very wide, so always preview the result before printing.
Essential Excel Keyboard Shortcuts for Beginners
| Shortcut | Action |
|---|---|
| Ctrl + C | Copy |
| Ctrl + X | Cut |
| Ctrl + V | Paste |
| Ctrl + Z | Undo |
| Ctrl + Y | Redo |
| Ctrl + S | Save |
| Ctrl + F | Find |
| Ctrl + P | |
| Ctrl + A | Select all in the relevant context |
| Ctrl + T | Create a table in desktop Excel |
You do not need to memorize every Excel shortcut.
Start with the commands you use most often.
Common Errors and Beginner Best Practices
Excel sometimes displays an error instead of a result.
Do not panic. The error is information about what went wrong.
#DIV/0!
A formula is attempting to divide by zero or an empty value treated as zero in that calculation.
#NAME?
Excel does not recognize something in the formula, possibly because a function or defined name has been entered incorrectly.
#VALUE!
The formula received a value or data type it cannot use as expected.
#REF!
A formula contains an invalid cell reference, often because referenced cells were deleted or moved in a way that broke the reference.
#####
A series of hash symbols often means the column is not wide enough to display a formatted numeric or date value, although other situations can also produce this display.
Common Excel Beginner Mistakes
1. Typing Calculated Results Manually
If a result should change when the source data changes, use a formula instead of manually typing the answer.
2. Mixing Different Types of Data in One Column
A column should normally represent one type of information.
For example, a Date column should contain dates rather than a mixture of dates, comments and status labels.
Consistent data types also make sorting and filtering more reliable.
3. Leaving Blank Rows Inside a Dataset
Unnecessary blank rows can make structured data harder to work with.
4. Using Formatting as Data
Do not rely solely on a cell’s appearance to communicate essential information.
For example, instead of representing status only through manually applied formatting, consider having an actual Status field.
5. Merging Cells Throughout Data Tables
Merged cells may be useful for certain presentation layouts but can create difficulties in datasets that need to be sorted, filtered or analyzed.
6. Overwriting Formulas
Before typing into an unfamiliar cell, check whether it already contains a formula.
7. Forgetting Absolute References
If a formula should always refer to one fixed cell, copying a relative reference can produce incorrect results.
8. Not Saving Regularly
Save important work frequently and use appropriate cloud/version-history options where available.
How to Organize Excel Data Properly
A clean dataset is much easier to analyze later.
A good starting structure is:
- One header row
- One field per column
- One record per row
- Consistent data types
- No unnecessary blank rows inside the dataset
- Clear column names
For example:
| Date | Product | Region | Quantity | Revenue |
|---|---|---|---|---|
| 1 Sep | Product A | North | 5 | 500 |
| 2 Sep | Product B | South | 3 | 450 |
This structure will make future work with tables, formulas, filters, PivotTables and analysis much easier.
Should Beginners Learn Excel Drop-Down Lists?
Yes, once you are comfortable with basic data entry.
Drop-down lists can standardize values such as:
- Status
- Priority
- Department
- Category
They are created primarily using Excel’s Data Validation feature.
We cover this separately in our step-by-step Excel drop-down list guide, including dynamic and dependent lists.
What Excel Beginners Should Learn First
A good learning sequence is:
- Understand workbooks and worksheets.
- Learn rows, columns, cells and ranges.
- Enter and edit data.
- Format numbers, dates and text.
- Learn simple formulas.
- Learn SUM, AVERAGE, MIN, MAX and COUNT.
- Understand relative and absolute references.
- Organize data into tables.
- Learn sorting and filtering.
- Create simple charts.
- Practice with a small real-world workbook.
Do not rush into advanced functions before you understand cell references and basic formulas.
Practice Project and Learning Roadmap
Create a simple monthly expense tracker with these columns:
Date
Category
Description
Amount
Payment Method
Add at least ten example transactions.
Then:
- Format the Date column as dates.
- Format Amount as currency.
- Use SUM to calculate total spending.
- Use AVERAGE to calculate the average transaction.
- Use MAX to identify the largest amount.
- Convert the dataset into an Excel Table.
- Sort by Amount.
- Filter by Category.
- Create a simple chart summarizing useful information.
This single project practices most of the core skills in this guide.
Excel Beginner Learning Roadmap
| Stage | Learn | Practice |
|---|---|---|
| 1. Navigation | Workbook, worksheets, rows, columns, cells | Navigate and rename sheets |
| 2. Data Entry | Text, numbers, dates | Create a simple dataset |
| 3. Formatting | Numbers, dates, alignment, borders | Format an expense tracker |
| 4. Formulas | +, -, *, / and cell references | Create calculated columns |
| 5. Functions | SUM, AVERAGE, MIN, MAX, COUNT | Create summary calculations |
| 6. References | Relative and absolute references | Copy formulas safely |
| 7. Data Organization | Tables | Convert a dataset into a table |
| 8. Data Exploration | Sort and filter | Explore your dataset |
| 9. Visualization | Basic charts | Create a simple chart |
| 10. Next Level | Practical Excel skills | Move to intermediate techniques |
What Should You Learn After Excel Basics?
Once the fundamentals feel comfortable, move into practical Excel skills such as:
- IF and IFS
- SUMIF and SUMIFS
- COUNTIF and COUNTIFS
- XLOOKUP
- Conditional Formatting
- Advanced Data Validation
- PivotTables
- More useful charts
- Data cleaning
- Dynamic-array functions
- Power Query
- Dashboards
Those topics belong to the next stage of learning rather than your first Excel lesson.
Once this beginner foundation is comfortable, continue with our broader How to Use Excel guide for practical and intermediate Excel skills.
Frequently Asked Questions About Excel for Beginners
Is Excel difficult to learn?
Basic Excel skills are accessible to beginners. Advanced spreadsheet modeling and data analysis can become complex, but you do not need advanced skills to start creating useful spreadsheets.
What should I learn first in Excel?
Start with workbooks, worksheets, rows, columns, cells and data entry. Then learn formatting, basic formulas, common functions, cell references, tables, sorting and filtering.
What are the most important Excel formulas for beginners?
Before learning many functions, understand how formulas and cell references work. Then start with functions such as SUM, AVERAGE, MIN, MAX, COUNT and COUNTA.
What does the $ sign mean in an Excel formula?
The dollar sign is used to lock a row, column or both in a cell reference. For example, $A$1 is an absolute reference that remains fixed when the formula is copied.
What is the difference between a formula and a function?
A formula is an expression you create, such as =A1+B1. A function is a predefined calculation such as =SUM(A1:A10).
What is the difference between a workbook and a worksheet?
A workbook is the complete Excel file. A worksheet is an individual sheet inside that workbook.
What is a cell in Excel?
A cell is the intersection of a row and column. Each cell has an address, such as A1 or C10.
Should beginners learn Excel Tables?
Yes. Tables provide a structured way to organize related data and make common tasks such as sorting and filtering easier.
Should beginners learn PivotTables?
Eventually, yes, but not necessarily on the first day. Learn clean data structure, tables, formulas, sorting and filtering first. PivotTables will be easier to understand afterward; when you are ready, follow our step-by-step PivotTable guide.
Should I learn VLOOKUP or XLOOKUP first?
If your Excel version supports XLOOKUP, Microsoft currently describes it as an improved alternative to VLOOKUP for many lookup scenarios. However, a complete beginner should first understand formulas and cell references before focusing heavily on lookup functions. When you are ready to advance, follow our beginner-friendly XLOOKUP guide with step-by-step examples.
How can I get better at Excel?
Build small spreadsheets yourself. A budget, task tracker or expense report will teach you more than simply reading lists of functions because you have to combine data entry, formatting, formulas and organization.
Conclusion: Learn Excel by Building Spreadsheets
You do not need to learn every Excel feature before creating useful spreadsheets.
Start with the fundamentals:
Workbook → Worksheet → Cells → Data → Formatting → Formulas → Functions → References → Tables → Sort & Filter → Charts.
Then build something yourself : Create a budget , a task tracker or an expense sheet.
Make mistakes, inspect your formulas and improve the workbook.
Once these fundamentals become comfortable, you will be ready for the next level: conditional formulas, lookups, PivotTables, data cleaning, a beginner-friendly introduction to Power Query and Excel dashboards.
The goal is not to memorize Excel.
The goal is to understand the spreadsheet well enough to solve increasingly useful problems with it.
Data cleaning is one of the most useful next steps after learning the basics. Follow our practical guide to remove duplicates in Excel using six methods.
Continue Learning
Build on your Excel foundations with the Microsoft Excel Learning Hub and the practical Excel Formulas & Functions guide.
Comments are closed.